Mapping the MBTA Bus Network Redesign

Background and Goals

For the vanishingly few of you who both read this blog and are unfamiliar with the MBTA’s Bus Network Redesign, you can check out the details of the proposal on the MBTA’s website.

In short, the MBTA is undertaking its first bottom-up redesign of its surface transport network in 100 years. The vast majority of the T’s bus routes once were streetcar routes; some routes have seen minor-to-moderate modifications in the ensuing decades, but the need to avoid disrupting the live system — which governs the day-to-day realities of thousands of people — has always capped how much could be done. As part of the long-running Better Bus Project, the T has conducted a deep dive review of its existing routes, including their ridership and reliability (see the Better Bus Profiles) and user research speaking directly to riders and community members.

Years in the making, the T this month released a proposed redesign of its bus network — details at the first link. This is a massive undertaking, and I give the redesigners credit for very clearly trying to avoid the “We’ve Always Done It Like This” Syndrome that plagues so much of American transit planning (especially in Boston).

Like any proposal, it has its imperfections and flaws. From my perspective, there are some things I like, and some things I don’t. There already has been some initial community feedback, and the T has a docket of public meetings (in-person and virtual) through mid-summer to collect feedback.

For the most part, I don’t intend to use my platform here to evaluate the merit of these proposals. The most important voices here are those of community members — their opinions should be listened to first, and given paramount consideration. Instead, my hope is to add to the discourse by providing additional ways to view and conceptualize the redesigned network — mainly through maps.

(There is one area of the proposal which received swift and strong public criticism. I have a post, and a pair of maps, in the works on that, where I will attempt to illustrate the flaws that have been pointed out by the community, and hopefully offer some modest suggestions to improve the proposal to address those problems. Stay tuned.)

In this post, I will share a map I have created to illustrate the Redesign’s “15-minute network”: a series of bus routes that are proposed to have 15-min-or-better headways all day from 5am to 1am, seven days a week. I’ll use the map to highlight some system-level features of the Redesign, and hopefully provide a framework for deeper discussion.

The Previous 15-Minute Network

Some of you may recall that I made a similar map of then-current all-day high-frequency MBTA bus services in the past. My methodology was a little different, so it isn’t a perfect comparison, but it is a useful starting point for our discussion today.

I also wrote on ArchBoston a detailed analysis of this network and its notable features, as well as a follow-up analysis specifically on the Dorchester network. There were a few things that stood out in that analysis:

  • Very few circumferential or crosstown corridors — almost everything was radial
  • Morning peak frequencies were often higher than afternoon
  • The bus network “breathes”
    • An entire subnetwork of high frequency services turns on and off during the peak, providing much more comprehensive service during rush hour, but a signficantly sparser network during middays, evenings, and weekends
  • The entire northern quadrant of the network — everything between the Red Line and the Blue Line — was bereft of (intentional) high-frequency all-day routes, with the sole exceptions of the 111 in Chelsea and the 116/117 in Chelsea/Revere
  • Some communities, like Everett, don’t show up on the “Gold Network” (high freq all day) because they are instead served by a more diffuse number of routes spread across the city, operating at lower frequencies
  • The absence of the North Shore network — meaning the absence of consistent high frequency service — was conspicuous
  • The Dorchester network is one-of-a-kind, with features that don’t exist elsewhere
    • The network itself is actually three networks superimposed: a “10-minute all-day network”, a “15-min peak, low off-peak network”, and a “low frequency network” — most routes fall very cleanly into one of these three buckets

(Interestingly, that last point about the Dorchester network[s] seemed to be on the mind of the Redesigners as well — they’ve also adopted three primary tiers: a “≤15-minute all-day network,” a mid-frequency network that I’m guessing will be “15-min peak, 30-min off-peak”, and a low frequency network that, like Dorchester’s, would mostly see hourly services. I won’t really go into much detail here, but in my previous analysis, I did note consistent characteristics about each of the Dorchester subnetworks, and I see many of those ideas applied systemwide in the Redesign.)

I mention all of these points because I believe the Redesign recognized these features as well, and explicitly designed their proposal to address them.

The Proposed 15-Minute Network

The Redesign calls for a series of 26 high-frequency routes that would see 15-min-or-better headways all day everyday from 5am to 1am. This proposal goes much farther than the system I described above — in particular with its commitment to late night and weekend service. Vanishingly few corridors see any level of service approaching this currently. Routes on this network would be indicated by a “T” prepended to their route number: the T39, the T111, and so on.

I’ve spent a while digging through the weeds of the Redesign, and have concluded that the 15-Minute Network is composed of three kinds of routes.

Radial Routes

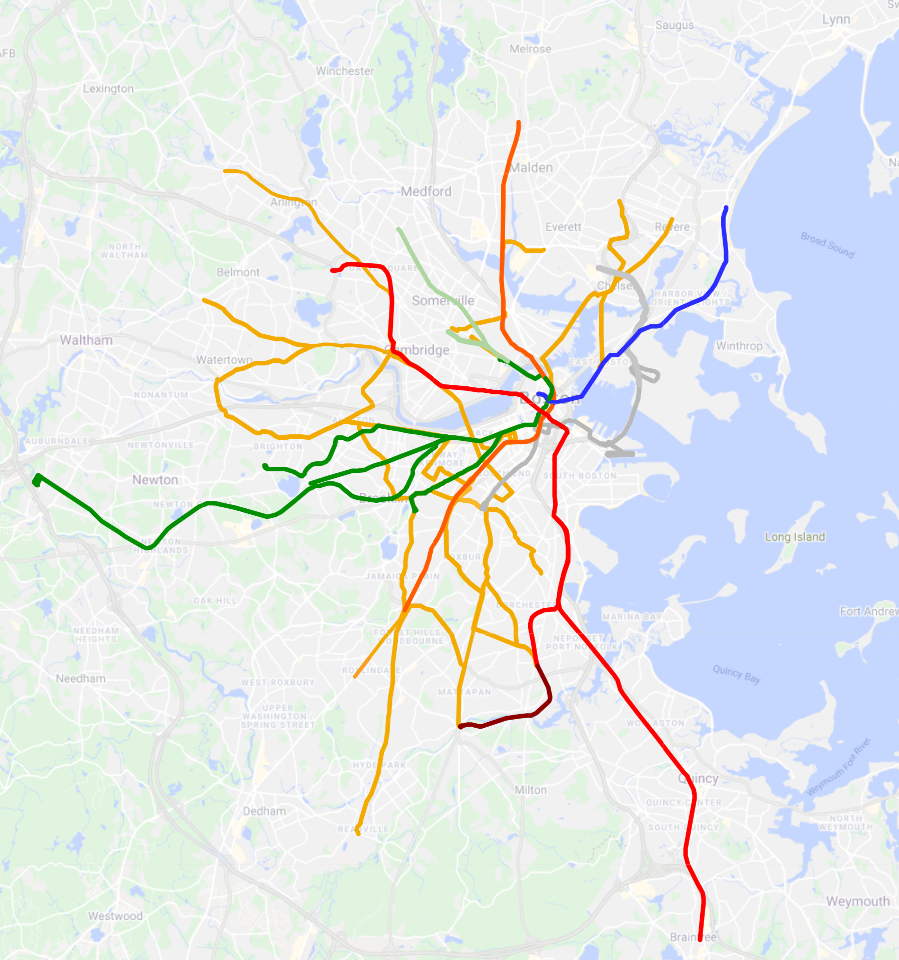
These are straightforward: routes that radiate out from the core, and which feed into major transfer stations such as Harvard or Forest Hills. On my map below, I have used a dark blue for these routes. Most of these routes are unsurprising, and many of them are identified on my Gold Network map above.

Circumferential Routes

These routes offer crosstown service that goes around the core rather than pointing toward it. Some of these routes behave like radial routes as they approach their terminals; for example, the southern half of the T96 essentially radiates out from Porter and Davis. So these routes still will be used by commuters going to downtown — but they also will enable journeys between multiple subway lines that can avoid going all the way to downtown. The T1 is a classic example, connecting Roxbury and Cambridge without requiring riders to change at Downtown Crossing.

Two exceptions

There are two proposed routes that do not fit cleanly into the categories above or below: the T109 and T101, both running through Sullivan. North of Sullivan, they behave clearly like radial routes, to Medford/Malden, and to Everett/Malden. South of Sullivan, they do something that bus routes historically have not done: continue on from one transfer station to another.

Traditionally, these would be considered circumferential routes. However, I have mapped them as radial routes — I believe the Redesigners are trying to reconceptualize these corridors as radiating instead from Harvard and from Kendall, passing through Sullivan somewhat incidentally. I of course have no insight into their actual thought process, but I think it reflects general trends they’ve shown in favor of longer routes that pass through multiple quadrants of the system.

Longwood Medical Area Routes

This is by far the most seismic shift in the redesigned network. For the first time, Boston is proposing a transit network that acknowledges that Longwood is a major employment center, a third “downtown” equivalent to Back Bay and the Financial District. See for yourself:

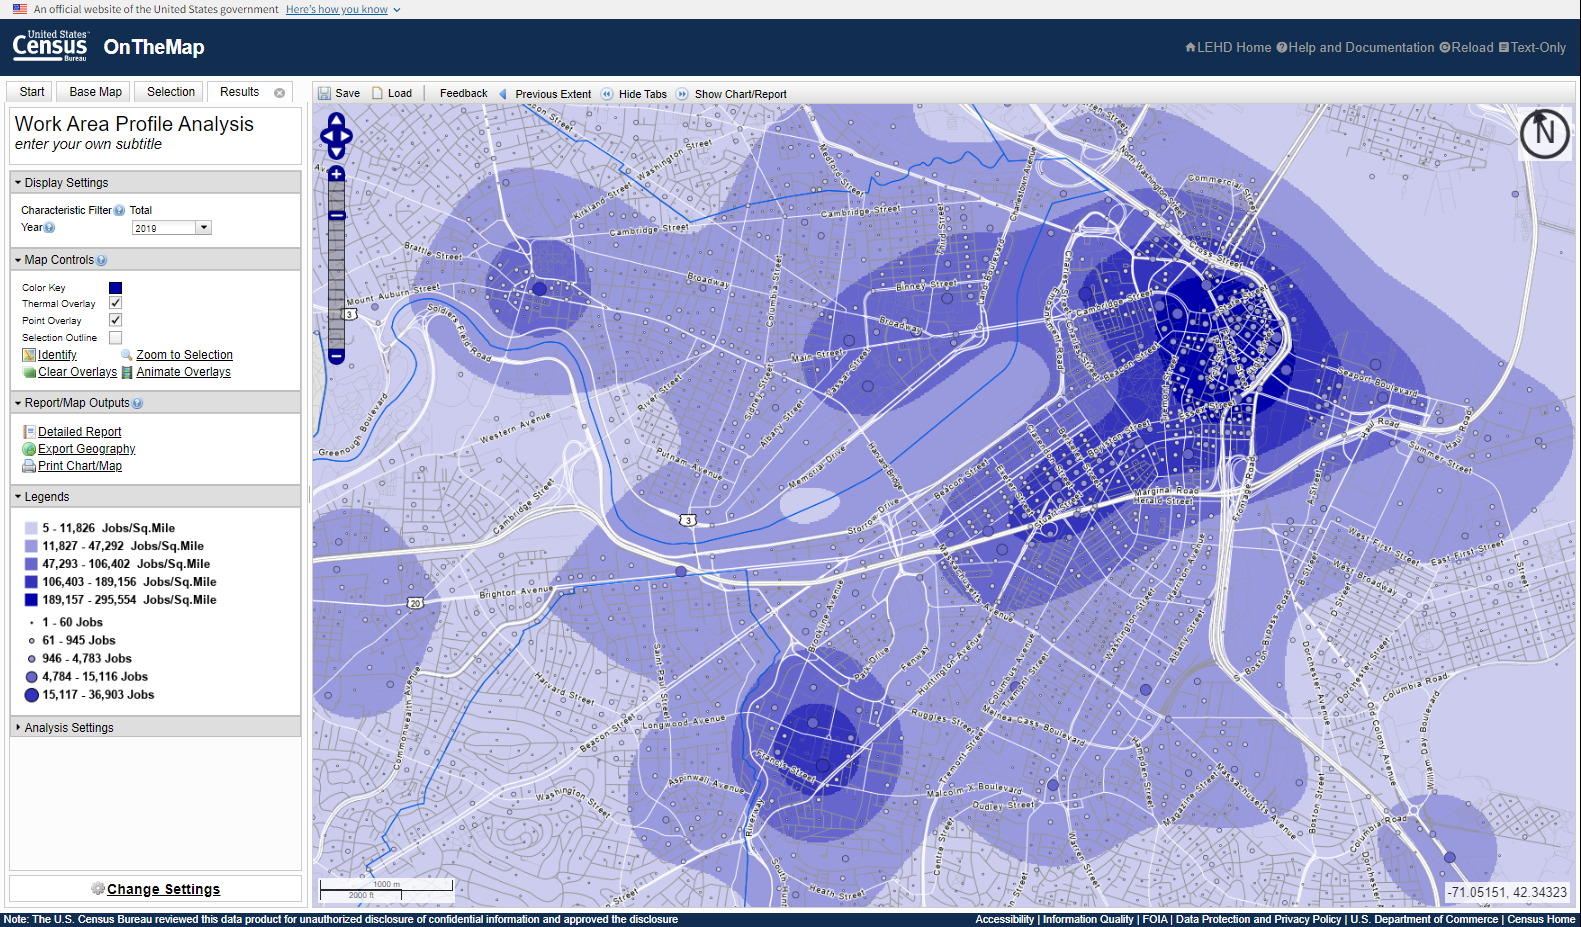
The current network requies riders to rely on employee shuttles, bus transfers at Ruggles, funneling riders on to the E Line and D Line, and lengthy walks. Despite being less than 2 miles away, commuters to LMA from Warren St currently have a single one-seat option — the 19, which only runs to Longwood during peak hours, mostly falls short of 15-minute headways during peak, stops running altogether by mid-evening, and offers no weekend service. (And it was no better pre-pandemic either.)

The Redesign proposes extending most major routes from Ruggles beyond to Longwood; it extends Cambridge crosstown service beyond Central to Inman, Union, and Porter; it adds a new crosstown route to the Seaport; and it increases frequencies on most existing routes.

When I did my analysis in 2020, the Kenmore-Longwood-Ruggles corridor saw 15 buses per hour during the morning peak, 4 per hour midday, and 6 per hour during the evening peak. The Redesign notes that exact routings through LMA are tentative pending further study, but by my count, the number of buses per hour between Longwood and Ruggles, Nubian, or Roxbury Crossing is proposed to increase to at least 20 buses per hour, all day.

I’ve colored the Longwood routes in dark red on the map. Some also act as radial routes to other hubs, and some do double duty as circumferential services in the larger network. But Longwood is undeniably the center of gravity, and makes for a distinct subnetwork, worthy of its own identification.

The Map

A few additional notes here:

  • This map is my creation, based on materials published by the MBTA; it is not an official map and any errors are mine. I recommend using my map as a jumping off point before reviewing the official materials.
  • Each route is marked separately and indicates a minimum of 15-minute headways (4 buses per hour) all day every day — I am sure that many if not most routes will see significantly higher headways during peak
  • Certain major bus stops are indicated, largely for the purpose of indicating transfer points to rapid transit; stop placement is not exact
  • Some potential “transfers” would require some walking, indicated by a dotted black line
  • The proposed Blue-Red Connector and potential Silver Line Extensions are indicated with dotted lines
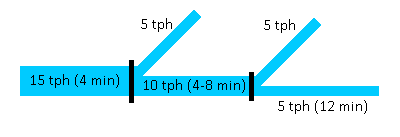
  • Some corridors see high-frequency service provided by layered mid-frequency services; these are mostly indicated by the line splitting and ending with arrows
  • This map is not precise and is meant to illustrate the overall network, not detail individual routes
  • Some routes have been simplified to reduce clutter. For example, the T39, T9, T70, and most of the routes in Chelsea, all have significant stretches where the route splits on to parallel one-way streets; most of these, I have simplified by drawing the route through the block in between the streets

And voilà:

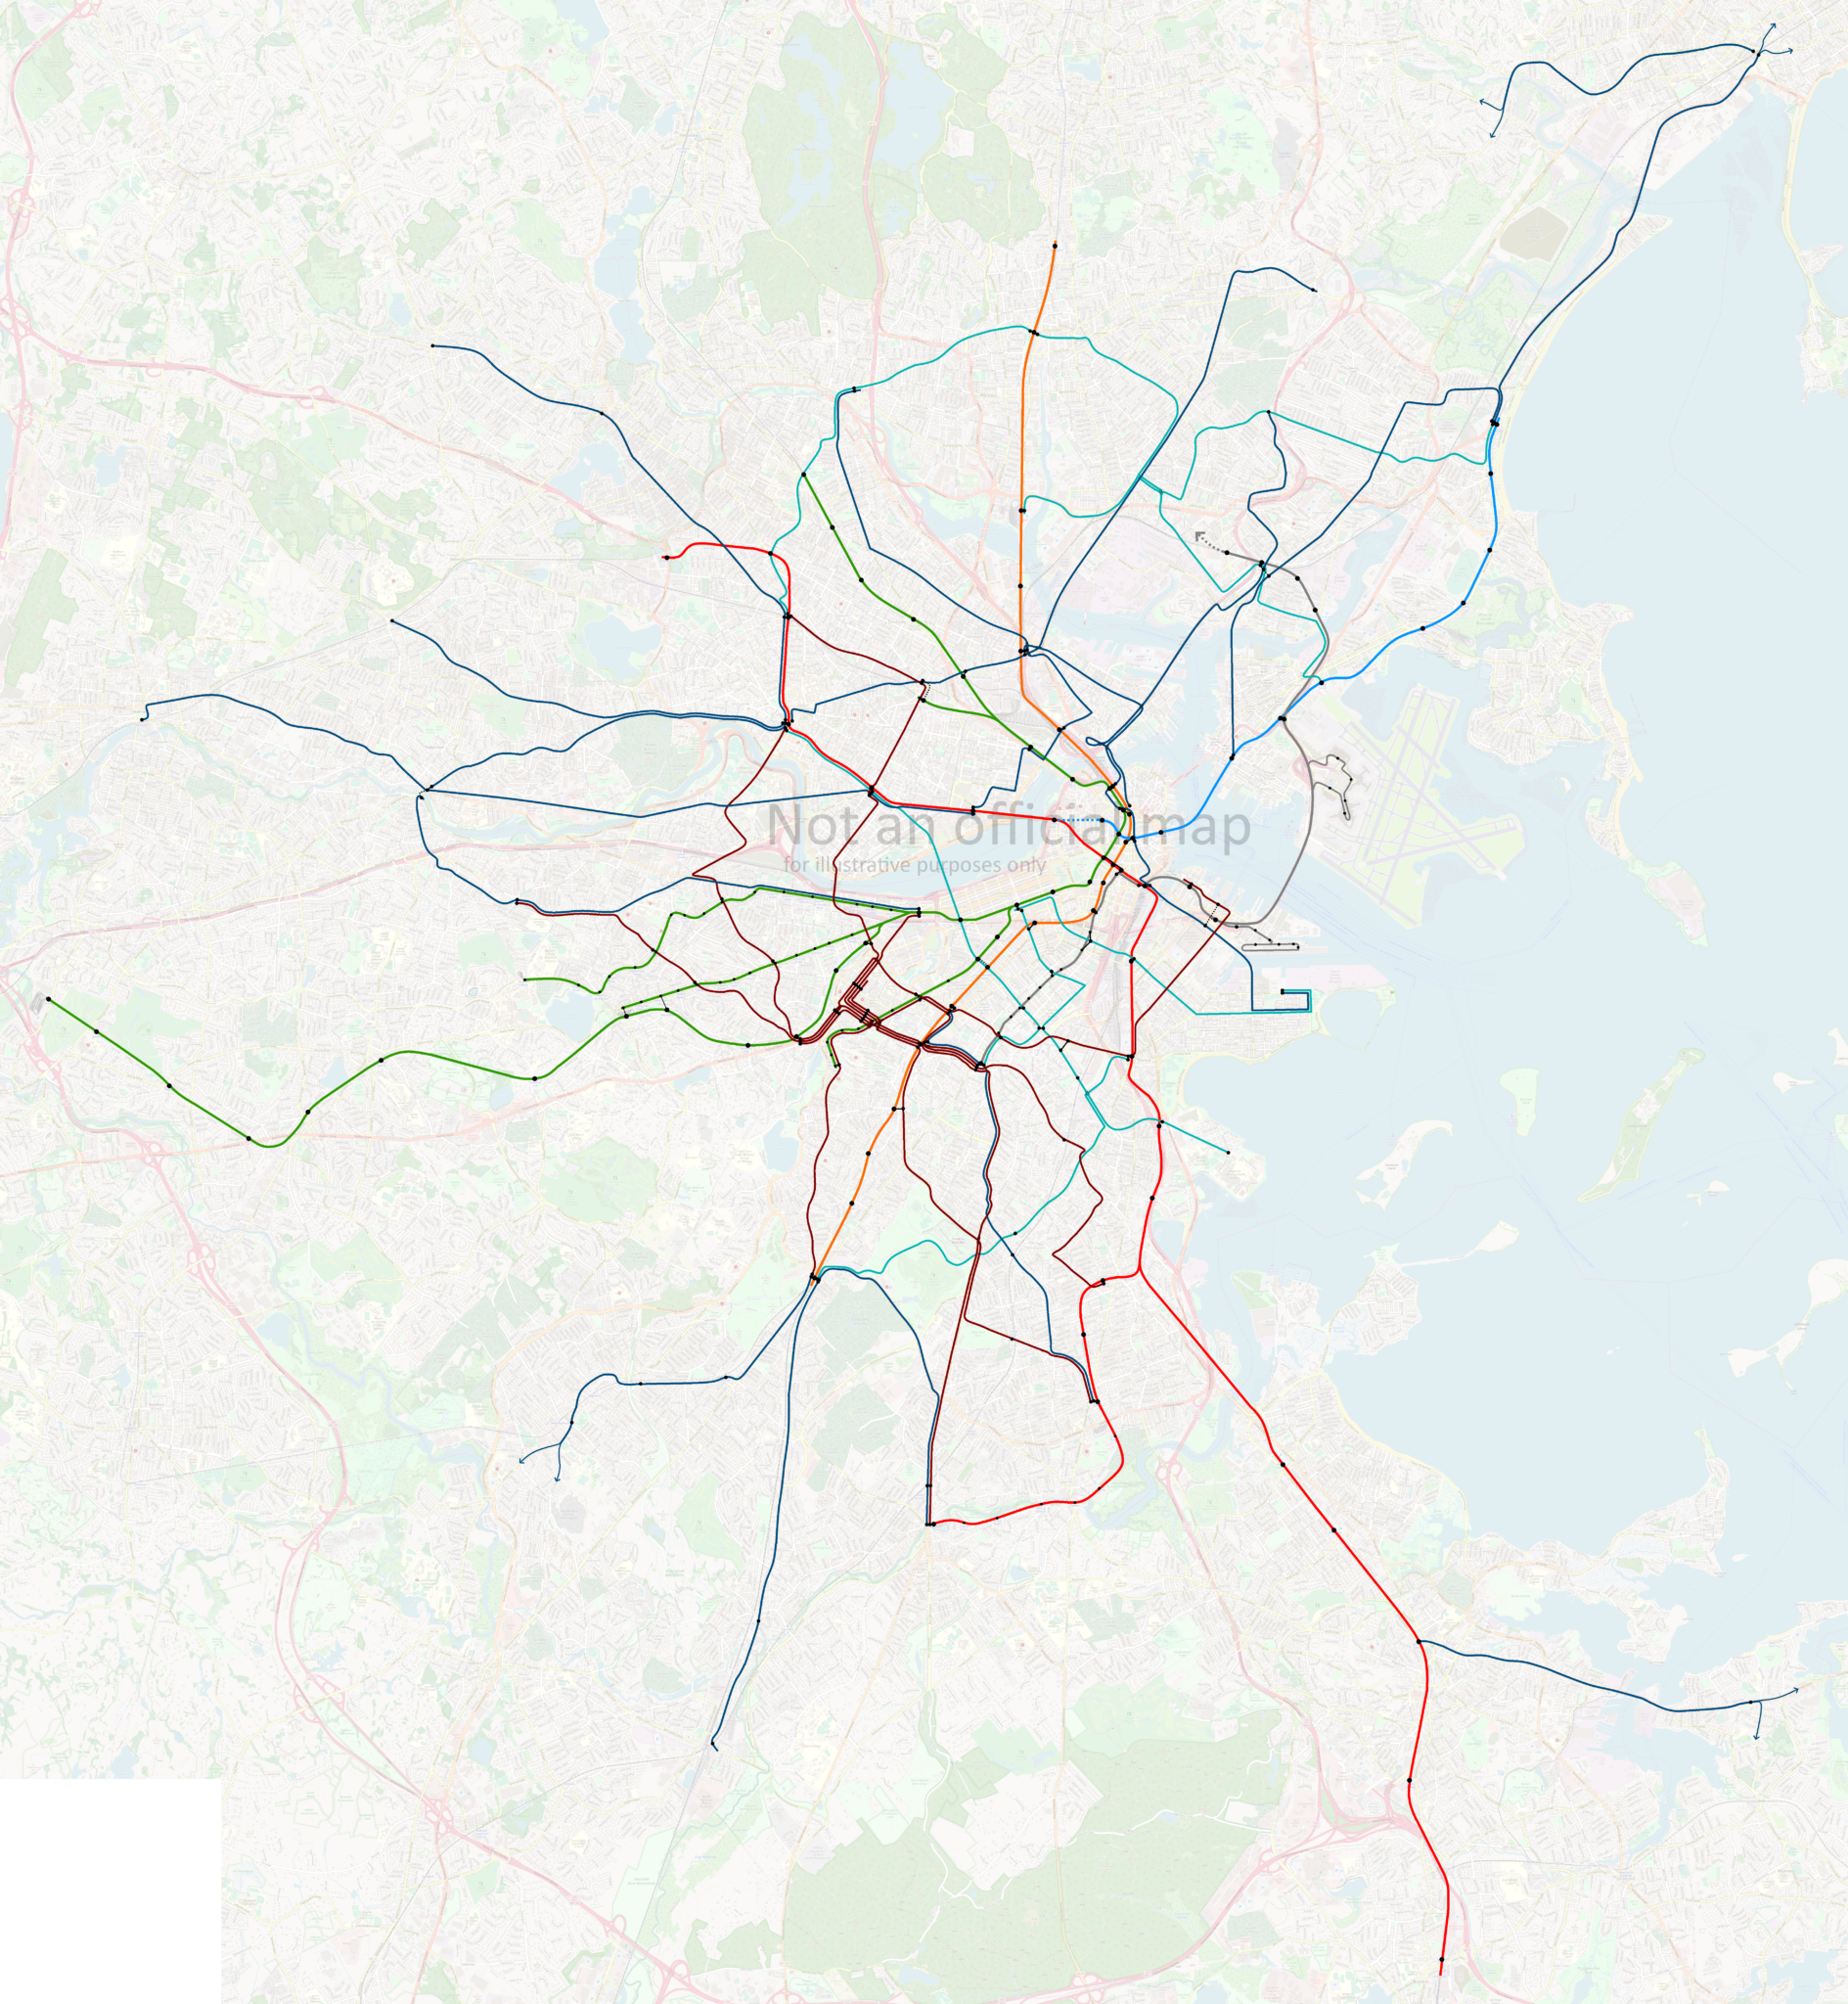
If the full-size version is killing your browser, here is a link to a slightly lower-resolution version.

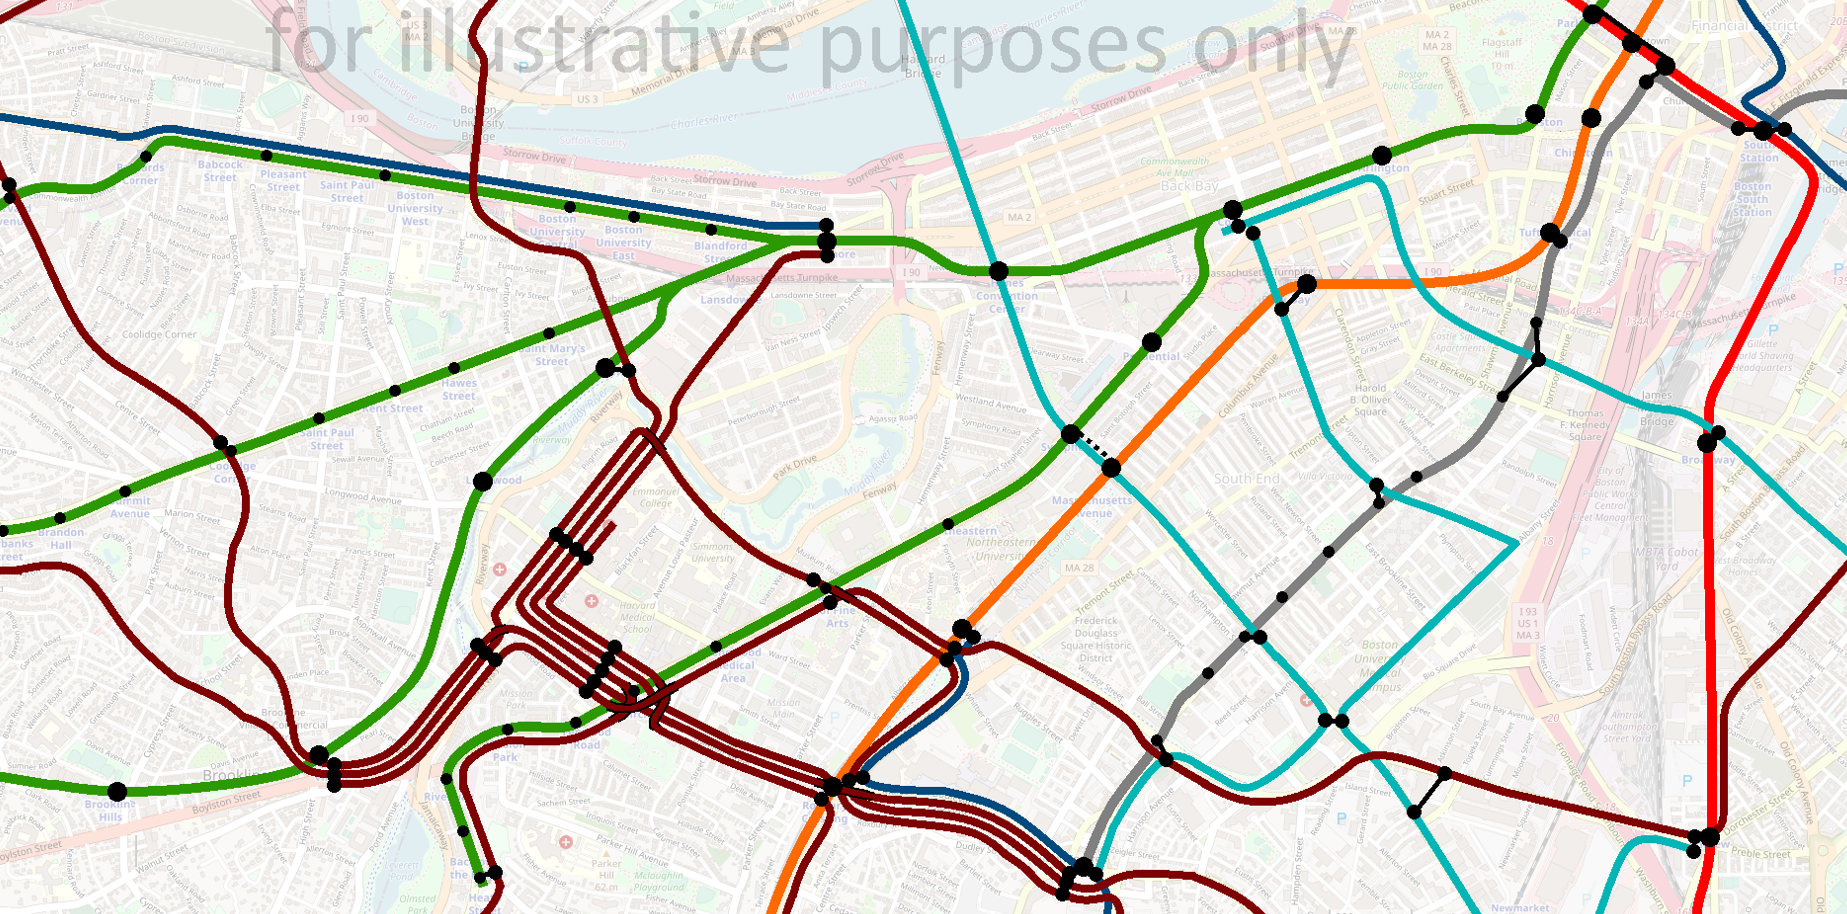
Here’s a detail view on Back Bay and Longwood, probably the most visually cluttered part of the map:

Conclusion

I do want to emphasize again that I am not trying to evaluate the quality or suitability of the Better Bus Project’s Bus Network Redesign proposals. There are elements of the proposal that I believe are transformative in that they are shifting the conversation in ways that are vitally necessary: centering Longwood, insisting on consistent high frequencies all day everyday, and creating wholesale new corridors that do not descend from the old streetcar network.

But the devil is always in the details, and there are many details to sort through in this proposal. My hope is that my overview and map can make it easier for you to wrap your head around this sprawling project, and from there, dive into the details, well-armed with a larger context.

Inevitabilities in Life: Death, taxes, and decreased frequencies on branches

In my previous post about branches, I briefly discussed the rapid decrease in frequencies as you add more branches to a trunk line. You might remember a diagram that I showed: 

A service level diagram, where the trunk has 15 tph, and then 5 tph branch off, leaving only 10 tph to the next station, after which the line splits into two branches of 5 tph each

In this diagram, the trunkline sees high-frequency headways of 4 minutes (which is better than many subway lines in North America). With such a high frequency, it’s easy to think that there’d be enough trains to serve a bunch of branches.

But as you can see, four-minute headways equals 15 trains per hour. If you have three branches, that means each branch gets 5 trains per hour – which yields 12 minute headways. If these branches are out in suburbia, 12 minute headways might be appropriate, but you’ve nearly reached the limit. If you were to add a fourth branch, each branch would see less than 4 trains per hour, at 16 minute headways, at which point you really no longer have a claim to “frequent service”.

In my last post, I recommended, as a rule of thumb, no more than two branches per line. However, I didn’t explain why. It comes down to a combination of typical throughput capacities, and mathematical inevitabilities. 

Divvying up trains-per-hour among multiple branches

Consider this chart:

I will post a text version of this table in the next few days!

On the left side, we have a list of potential trunkline capacities, measured in trains per hour. These indicate how many trains in each direction you can squeeze through your trunkline in an hour. (Don’t worry about converting these numbers to headways – I’ll get to that below.) 

For some perspective (most numbers pre-covid): 

  • BART ran 16 tph through its core section from Daly City to West Oakland
  • CTA ran between 12 and 20 tph on its Red and Blue Lines during peak
  • WMATA ran 15 tph on its Red Line during peak
  • MBTA ran 15 tph on its Red Line during peak
  • London Underground’s throughputs vary widely from line to line, with some lines seeing over 30 trains per hour, following major infrastructure and modernization improvements
  • Beijing’s subway runs between 30 and 35 tph on several of its routes
  • Shanghai’s subway runs between 15 and 32 tph on most of its inner routes

All of which is to say, the top few rows represent trunkline capacities that require major investment in transportation infrastructure.

To the right of those trunkline capacities are the number of trains available to each branch, depending on how many branches you have. So, for example, in the first row, a 40 tph trunk will provide 20 tph to two branches, 13.3 tph to three branches, 10 tph to four branches, and so on. 

As mentioned before: you’ll notice that, as you move from left to right across the chart, the numbers in each row drop dramatically. In fact, the decrease is literally exponential; you can describe the chart above using

y = n-x

where n is the capacity of your trunkline in tph, x is the number of branches, and y is the resulting tph per branch.

Decreasing frequencies due to decreasing tph

It’s helpful to start this discussion using tph as a measure, because it’s easier to recognize the patterns in the numbers’ decrease. However, once we convert those tph into headways, it’ll become that much clearer why branching quickly leads to decreased frequencies.

I will post a text version of this table in the next few days!

I’ve added some (opinionated) color-coding, meant to suggest the various “levels” of service these different frequencies provide. 

  • The bright green (every 5 minutes or better) represent the highest tier of frequent service an agency might provide. “Turn up and go.”
  • The pale green (every 5-10 minutes) are still comfortably in the realm of rapid transit, but are probably better suited to off-peak periods and lower-ridership networks. “Turn up and wait a couple minutes and go.”
  • The yellow (every 10-15 minutes) are the lowest tier of what could be considered “turn-up-and-go,” describing services where riders don’t need to check a schedule when planning journeys. Call this tier “turn up and wait.”
    • This tier should be approached cautiously, with careful attention paid to the specific corridor where these frequencies would be deployed.
    • (Sadly, consideration should also be given to reliability; if a bus is scheduled to show up every 13 minutes, but one run gets dropped, suddenly you have folks waiting nearly a half-hour for their bus.)
  • The subsequent tiers are rarely going to be considered “frequent service”; some could be “salvaged” by adhering to a strict clockfacing schedule: a route that reliably comes exactly :13 minutes and :43 minutes past the hour can be a useful service that isn’t “turn-up-and-go”, but doesn’t require consulting a schedule either. These tiers break down something like this:
    • Orange = “plan when to leave, but journey whenever”
    • Light grey = “plan when to journey”
    • Dark grey = “schedule around the schedule” 

As you can see, our frequencies drop through the tiers I’ve described above quite quickly. Once you hit the yellow tier, you’re teetering on the edge of frequent service, and once you hit the orange and beyond, you’re definitely over the edge.

Different regions will have different definitions of “high frequency”. For example, it’s pretty rare to wait more than 4 minutes for a tube train in central London; a six-minute headway would be considered sub-par. In Boston, we are sadly accustomed to six-minute peak headways on the Orange Line, while Baltimore’s subway sees peak service every 8 minutes. 

It’s worth highlighting that reaching 90-second headways at 40 tph on heavy rail is exceptionally difficult. If you have multiple tracks in the same direction, it becomes more manageable, but a standard two-track subway is nearly impossible to operate at 40 tph per direction, outside of the world’s most advanced subway systems. And notice – even the top examples I listed above, such as Beijing or London, you’re still looking at that second row as your baseline, at around 30 tph. Even in those systems, having more than two branches knocks each branch down into a lower “tier”, meaning it’s not suitable to do within the urban core. 

If your crayon map requires shoveling 40 trains per hour through a trunk line, then probably it’s worth trying to plan a second trunk line!

Gaming out examples, and dealing with the unideal real world

Many of the North American systems I mentioned above see 4 minute headways on their core. If we go to that row, we can see two branches gives us 8 min (good so far), three branches gives us 12 min (borderline), and four branches gives us 16 min (no good). 

Some North American systems see base headways of 7 or 8 minutes. In that case, our drop-off happens even faster: 2 branches becomes borderline, and 3 branches sinks us with headways longer than 20 minutes.

On the London and Chinese systems mentioned above, trunklines see headways around 2 minutes or better. In theory, those trunklines could accommodate five or six branches; but if you drop the core headways by just one minute, suddenly you can only accommodate three or four branches at similar frequencies. 

And that “in theory” caveat is what’s really going to get us. Even if you can squeeze 30 tph through your trunkline to get 2-min headways, if you are feeding that trunk from five branches, that’s five times as many opportunities for delays and disruptions. We just saw above that the difference between a 2-min headway and a 3-min headway is worth two whole branches of throughput. That’s a very thin margin for error – meaning that you need reliability to be extremely high, or else the whole system will unravel, with cascading delays across your network.

The exceptions that prove the rule: North American legacy subway-streetcar networks

There are only two networks that I’m aware of which see sub-10 minute headways on four or more branches, feeding into a trunkline handling 40 tph: the MBTA’s Green Line and SEPTA’s Subway-Surface Lines.

This level of throughput is achieved (see caveat below) mostly because they are light rail lines rather than heavy rail. This means shorter trains which can start and stop faster, and therefore can be run closer together (albeit at lower speeds). The MBTA allows multiple Green Line trainsets to enter certain stations simultaneously, and SEPTA actually treats a couple of its subway stations as “request stops”, with trolleys rolling through non-stop if no one signals to board or alight. 

(I haven’t done the math on this, but it would be worth someone calculating the actual capacity of those two systems compared to heavy rail equivalents. It is true that the TPH levels are higher, but since the trains are shorter, I don’t know that you actually end up carrying more passengers.)

The reality, sadly, is that both of these networks are infamous for their reliability issues. (Full disclosure: I’m much more familiar with the MBTA than SEPTA, but I believe most of the T’s problems also exist in Philadelphia.) Delays are common, both on the branches and then resultantly in the core, potentially resulting in less than forty actual trains per hour through the core. 

Having four or five branches is somewhat workable on these two systems due to their unusual characteristics. Replicating that success elsewhere would likely require replicating those characteristics as well.

The other exceptions that prove the rule: hybrid rapid transit/commuter rail systems

BART’s core trunkline from Daly City to West Oakland feeds out into four eastern branches (Richmond, Antioch, Dublin/Pleasanton, Berryessa/North San Jose). Likewise, the London Undergroud’s Metropolitan Line runs to four termini in the northwestern suburbs (Uxbridge, Amersham, Chesham, Watford). 

Both networks accomplish this by running service to distant suburbs that is more like high-frequency commuter rail than traditional rapid transit service. Each branch on the BART runs every fifteen minutes, which isn’t super unreasonable given that most of those branches travel over thirty miles from downtown San Francisco. (BART is also a pluricentric network, which makes the ridership patterns a bit different than, for example, Chicago’s.)

The Met in London is a bit more complicated, but the concept is similar. Similar to New York, and unlike BART, the Metropolitan is quad-tracked for certain stretches, and therefore runs both local services and express services. During peak hours: 

  • Uxbridge sees 10 tph (6 min) spread across local and express services, with 4 of those trains short-turning at Baker Street
  • Amersham sees 4 tph (15 min), half of which are express
  • Chesham sees 2 tph (30 min)
  • Watford sees 8 tph (7.5 min), again with some short-turns and some expresses

A couple of further notes for context:

  • Almost all of the Uxbridge branch is also served by Piccadilly trains – 12 tph at peak – providing a robust 22 tph, which creates headways under 3 minutes
  • The Amersham and Chesham services run together until Chalfont & Latimer, before splitting off and going one stop each to their terminus, meaning most of the branch in fact sees 6 tph; these services are also supplemented by at least 2 tph that run on Chiltern Railways to Amersham and beyond. 
  • Chesham is also the most distant Underground station – 25 miles from Charing Cross in central London, and technically outside of Greater London – well into territory where 30-minute headways might be reasonable
  • The town of Watford is served by three other stations; the largest of these is Watford Junction, which is less than a mile from the Met station, and sees 4 Overground trains and about 5 London Northwestern Railways trains toward London per hour

So, the Met has a few mitigating factors:

  • Its branches are supplemented by additional services
  • Despite four possible termini, really it just has three branches, one of which splits at the very end
  • The only stations that see 15-minute-or-worse headways are distant suburbs, over 20 miles from the core of London

Like SEPTA and the MBTA, both BART and the Metropolitan also have unusual characteristics that enable them to get away with breaking my “two branches max” rule of thumb.

However, both BART and the Met also have an additional special feature that allow them to have their cake and eat it too… to be continued in the next post