As often happens when one returns to something, on review several months later, I strongly dislike the original version of this map (linked further down), and I am mildly dismayed to have been satisfied enough with it to post. I later posted about the latest iteration of this concept, but I’ll keep this post in place for posterity. The first diagram in this post is the latest version; older versions are available at the hyperlinks.
There is also an intermediate redesigned version here, but I’d definitely prefer you take a look at the one above instead.
The original draft is available here. It keeps showing up in Google Image Search, and I’d much prefer the latest version be more prominently displayed there, so I’m trying to deemphasize it on this page. Original post below is in regard to the original draft, although you’ll see that a lot of the details apply to the latest iteration as well.
My original comments begin here:
To be clear, this is a proof of concept; there are a number of small details that need correcting, and while I think the overall concept works, there are some clear areas for improvement in a subsequent revision. But, I think it does prove out the concept.
Background
The current diagram draws clear lineage to the Cambridge Seven Associates’ original diagram (which captured my imagination as a child with its simplicity and elegance, particularly when it looked more like this). Today’s diagram is much more complicated than the original, due to the need to add additional information, including
- Accessibility markers
- Explicit markers for all stops on the Riverside Line
- Explicit labels for all stops on the B, C, E, and Mattapan Lines
- The Silver Line
- Commuter rail stops (particularly along the Fairmount Line)
- Key bus routes
Plus the editorial decision to include the geographic markers of the shoreline.
That last point reveals a fundamental difference between the original and current diagrams: the original made zero effort to appear geographically accurate, while the current makes some effort to hint at accurate geography… in some places.
The right half of the map – the South Shore, South Boston, the Shawmut Peninsula (a.k.a. Downtown), Charlestown, East Boston, and the communities along the Mystic River – is vaguely accurate, albeit somewhat compressed.
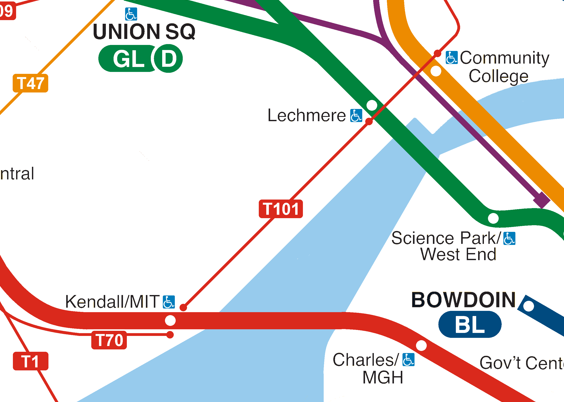
The left half, by contrast, is much more diagrammatic: straightening and simultaneously stretching & compressing the four branches of the Green Line, straightening and simplifying the Red Line and Key Bus Routes, while maintaining some suggestion of a geographically accurate Charles River.
Kenneth Dumas, the designer of the current diagram (and its previous iterations going back to 2000 when the shift was made away from a purely non-geographic diagram), has spoken about the process by which we arrived at today’s diagram; it’s a fascinating watch that I highly recommend if you enjoy transit maps. Suffice it to say, the current diagram represents an effort to harmonize the desires of a wide range of stakeholders.
My goals
I have long wanted to design a diagram for the T that includes the following:
- Key bus routes, shown as cleanly as possible and designed into the map from the start
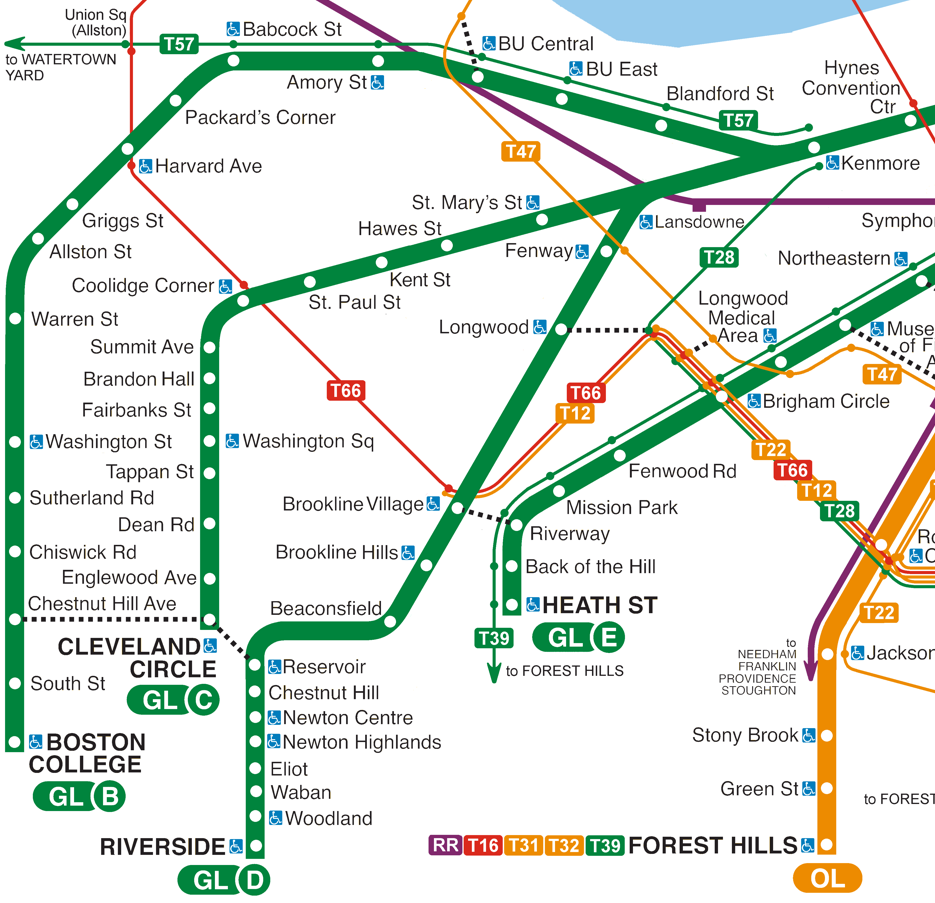
- All stops on the Green Line branches
- (I actually have not particularly wanted to list out all of the surface stops on the B/C/E Lines, but my understanding is that there is user research showing clear preference for their inclusion)
- Walking transfers, including
- State – Downtown Crossing,
- Copley – Back Bay,
- Symphony – Mass Ave,
- Brookline Village – Riverway, and
- Reservoir – Cleveland Circle
- All stops on the Fairmount Line (future-proofed for its eventual conversion to near-rapid transit standards)
- All information included on the present map
And achieve all of the above while fitting into a square and complying with relevant ADA visual design requirements (discussed in part in the video linked above). Now, Cameron Booth at transitmap.net has designed a gorgeous diagram that achieves just about all of these… but which could not fit into a square, which was a key requirement.
The design concept: geographically accurate inner zone & diagrammatic outer zone
Achieving my goals, while maintaining the information on the current diagram, posed several challenges. But as I thought about it further, I realized that several of the thornier issues could all be solved by a highly-geographically accurate diagram, including:
- Walking transfers,
- the Silver Line, and
- to a lesser extent, baking the key bus routes harmoniously into the design of the map
The physical paths of the Green and Orange Lines themselves provided a design to show the walking transfers; this was a key revelation for me: use the physical paths as the starting point for the design, rather than abstract ideas such as “I want the Orange Line to be as straight as possible and form a perfect right angle with a Red Line that is also as straight as possible” (see for example Michael Kvrivishvili’s original design).
At the other end of the spectrum, I got to thinking about Harry’s Beck’s use of a “To” box, listing off-map stops on a line. Cameron Booth offers a modern illustration of this in his Tube map redesign. This is probably the most extreme version of a non-geographic diagram: just a straightforward list of stops.
But, I wondered: was the use of the “To” box really that different from the current diagram’s treatment of the B/C/D/E Lines (and to a lesser extent the Blue Line and Braintree Line)?
There’s very little geographic information being conveyed on those outer lines; there are few or no transfers being shown; there are few or no eye-catching bends that might provide implicit visual cues. Especially on the Green Line branches, the current diagram really just uses a list of stations, along a colored line with white dots.
So, I wondered, what would happen if we had a diagram with a geographically accurate inner section and a maximally diagrammatic outer section?
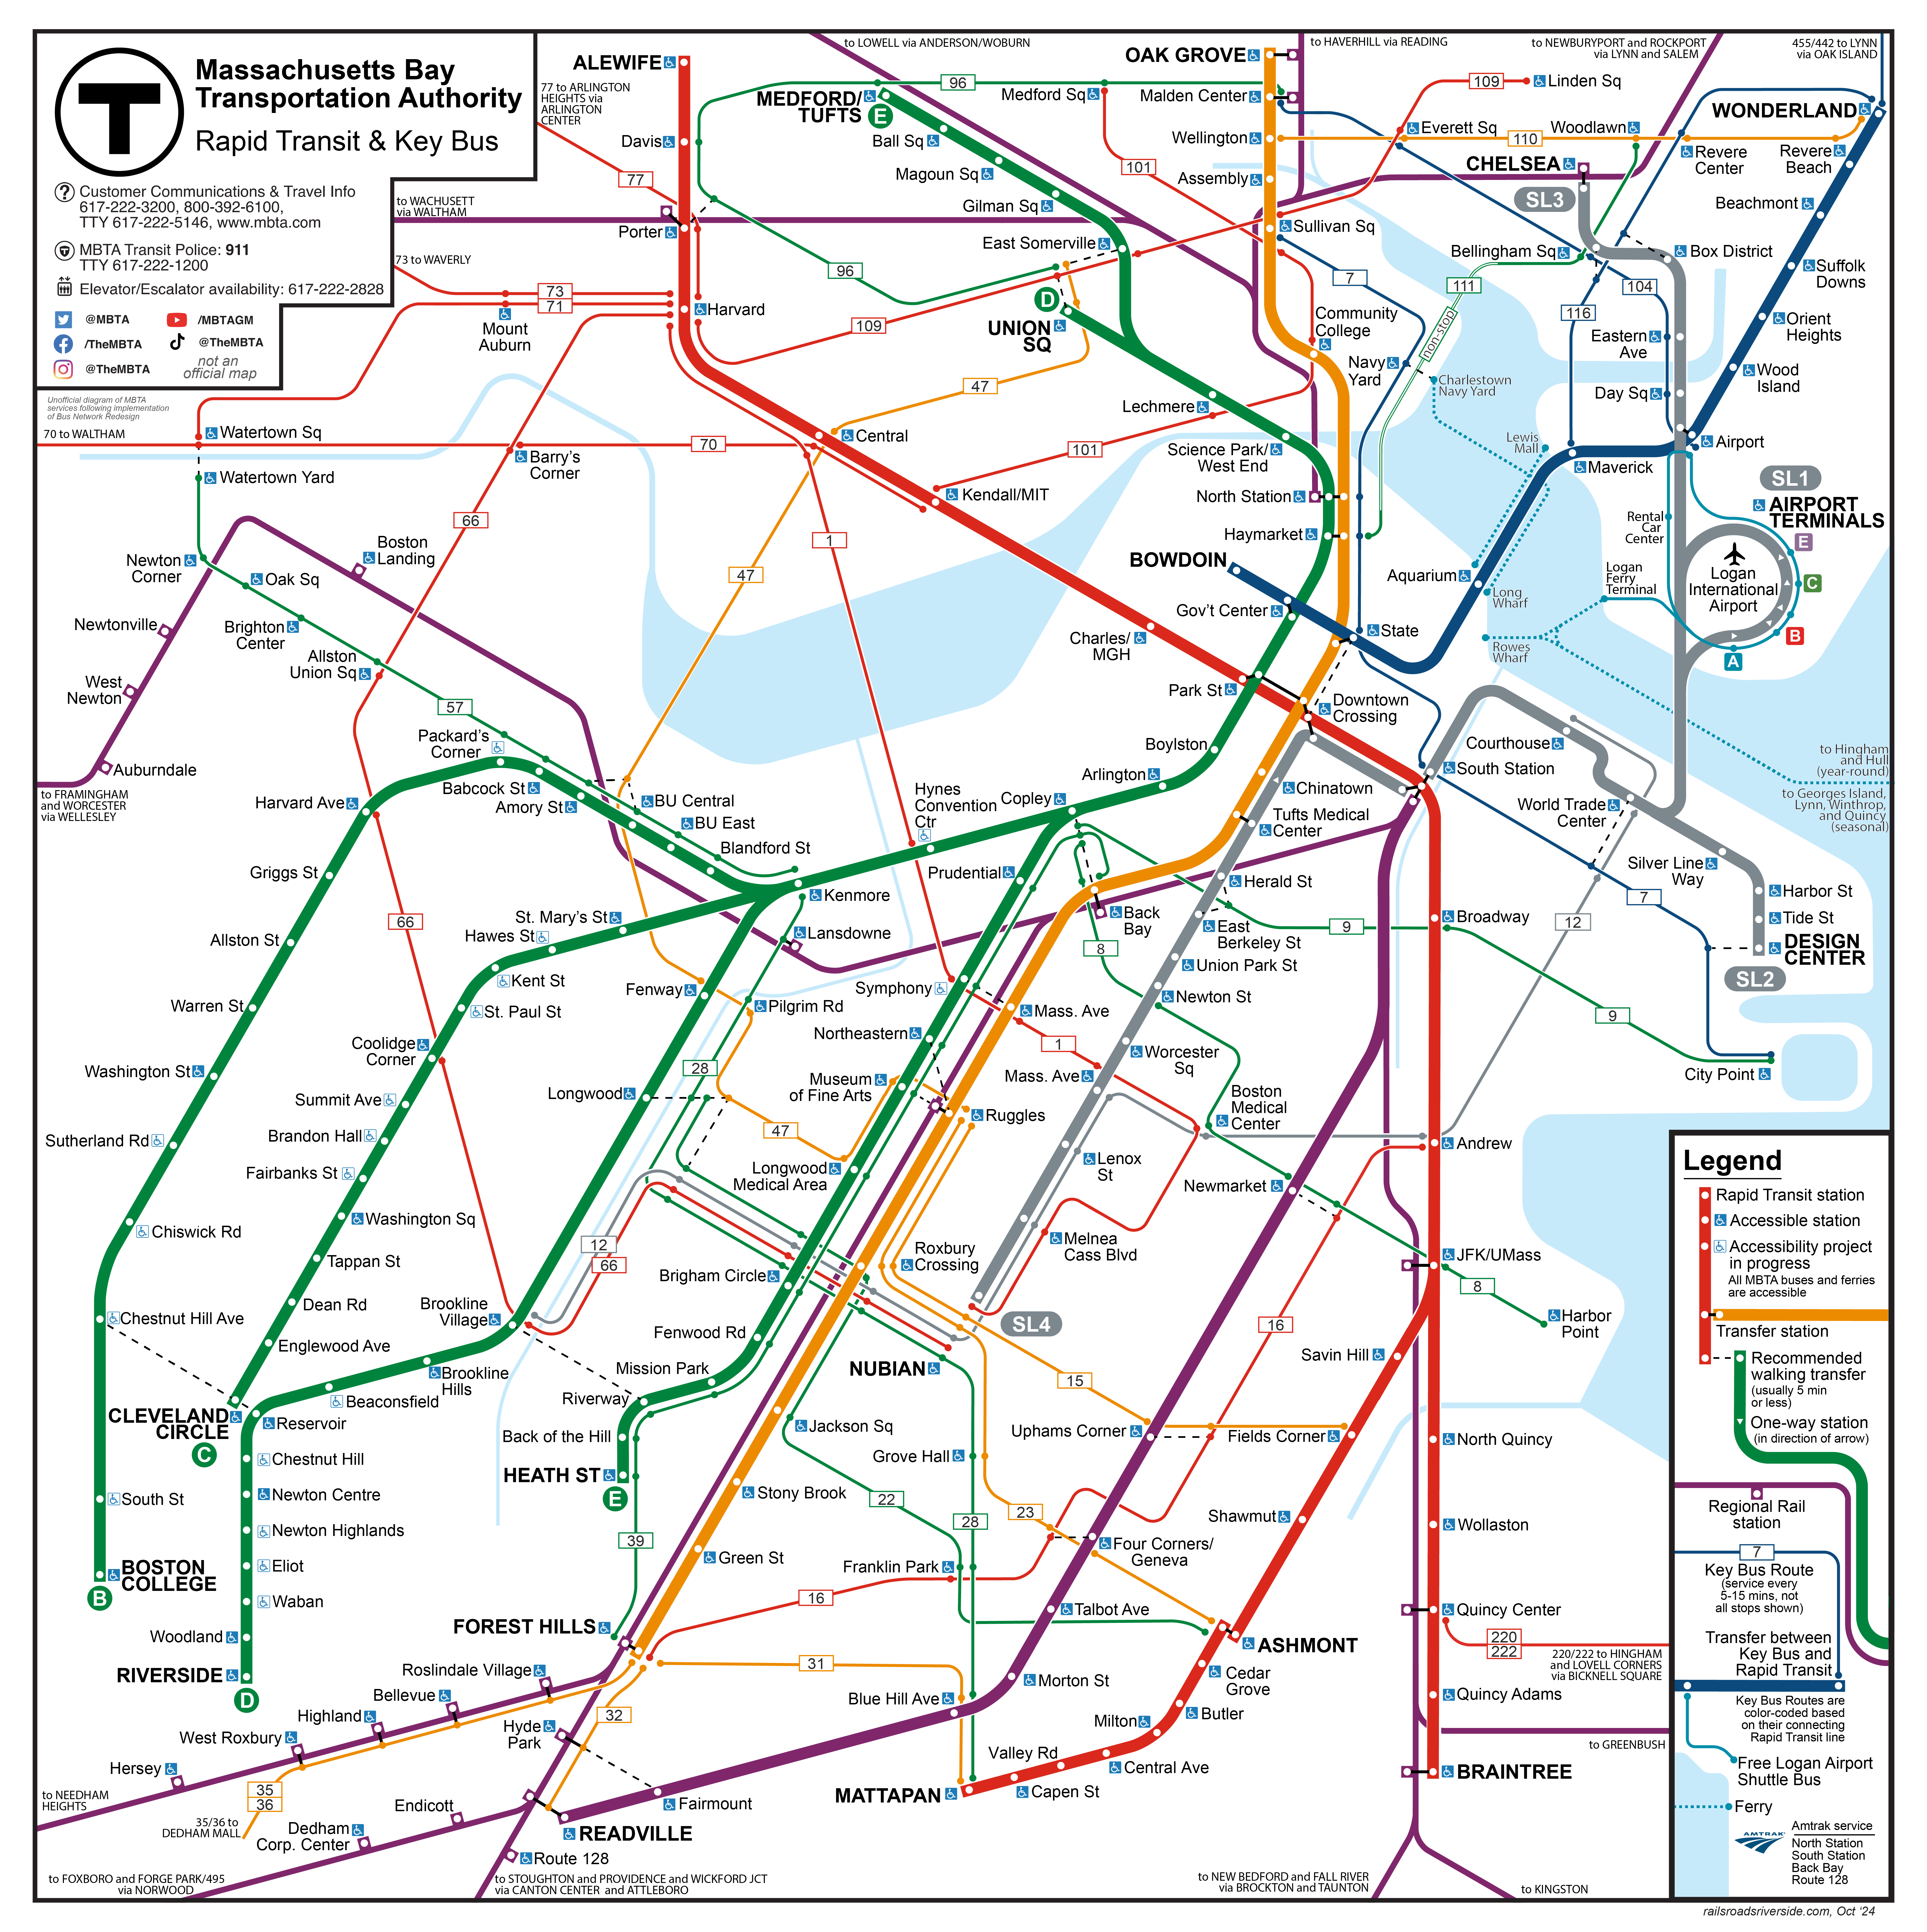
Hence, the map above at this link.
Notes on the map
A few things to draw attention to:
Sizing
This design uses the original map’s labels and other elements at their original size relative to the page. If printed on a piece of paper the same size as the current map, all of the labels (along with the widths of the subway and bus lines) should be the same size. I know there are ADA guidelines around things like sizing and visual contrast; by reusing as much of the original map’s design language as possible, I’m hoping to generally satisfy those requirements, even if I’m unfamiliar with them.
Alignment for bus routes
Stations are aligned so that connecting bus routes (in this design, the highest frequency “all-day-15-min” routes from the Bus Network Redesign) are maximally straight. These include:
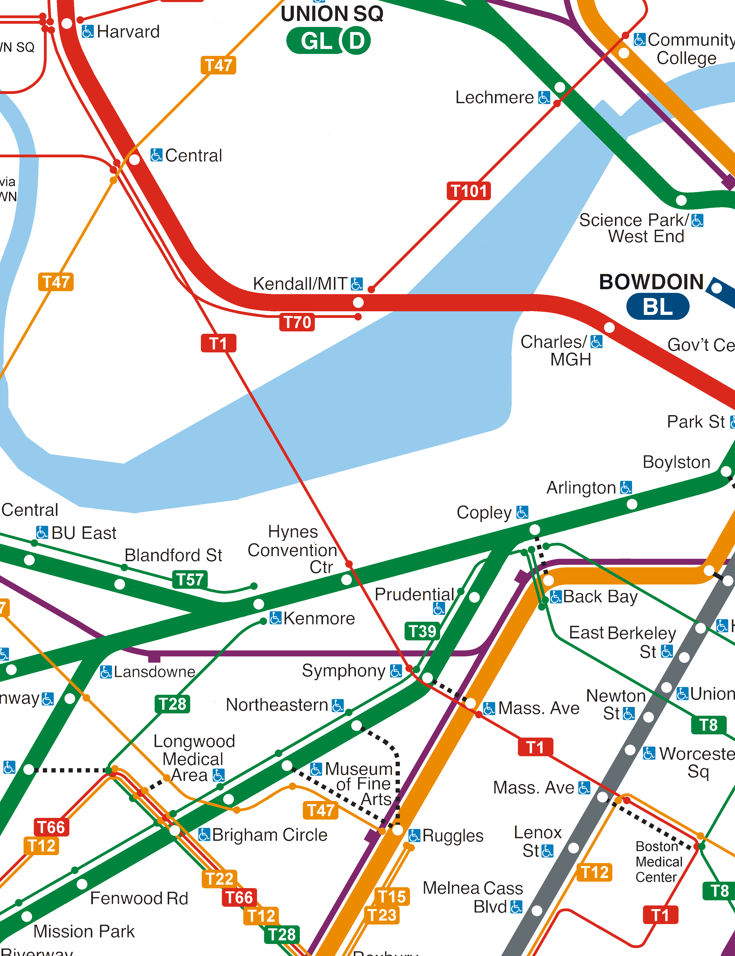
Non-geographic diagram in outer zone
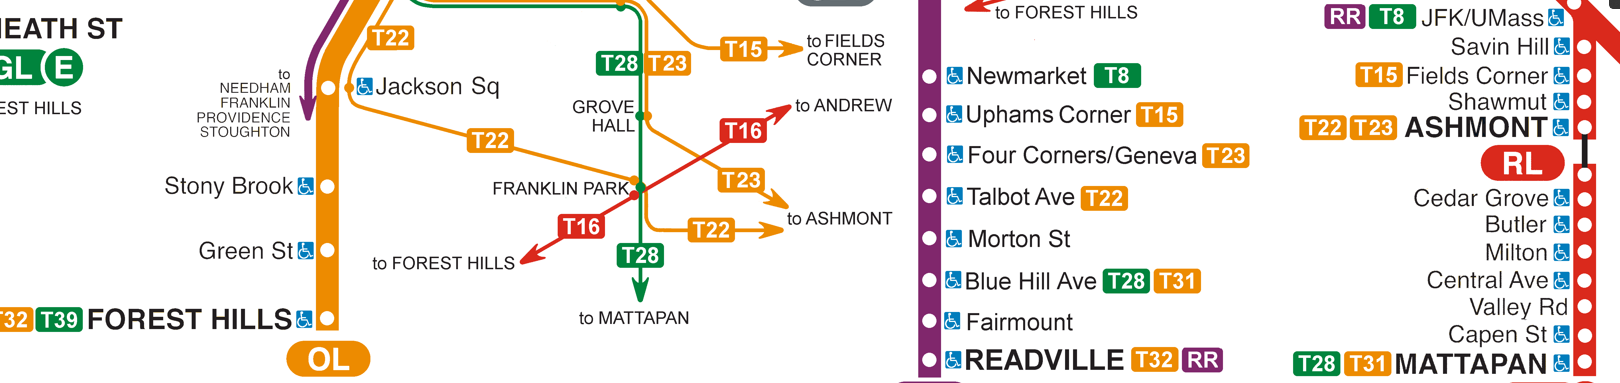
Outside of the “inner zone”, the geographic fidelity of the diagram drops so severely that there’s no way it can be interpreted as being anything other than what it is: a list of stations. This is reinforced by the disappearance of the bus routes and the coastline, and the addition of the “transfer labels” at each station. An earlier version of the diagram featured an explicit “box” delineating the inner vs outer zone; this became unwieldy, however, especially when dealing with the Green Line branches, so I opted instead for an implicit transition.
Color-coded bus routes
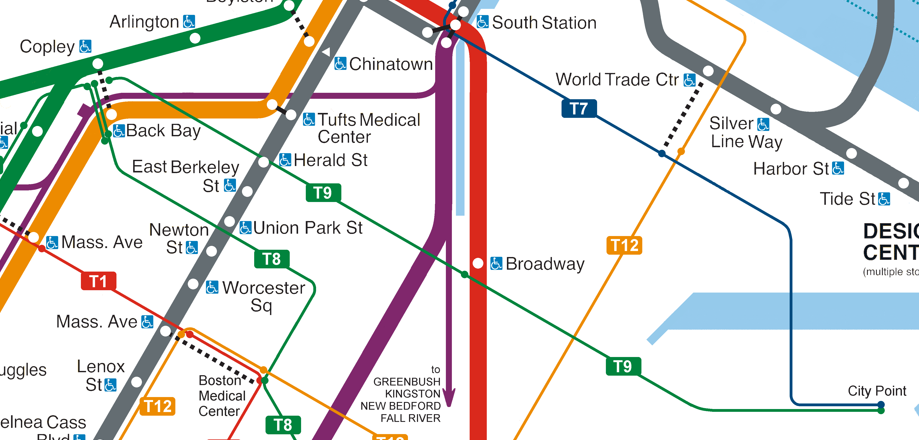
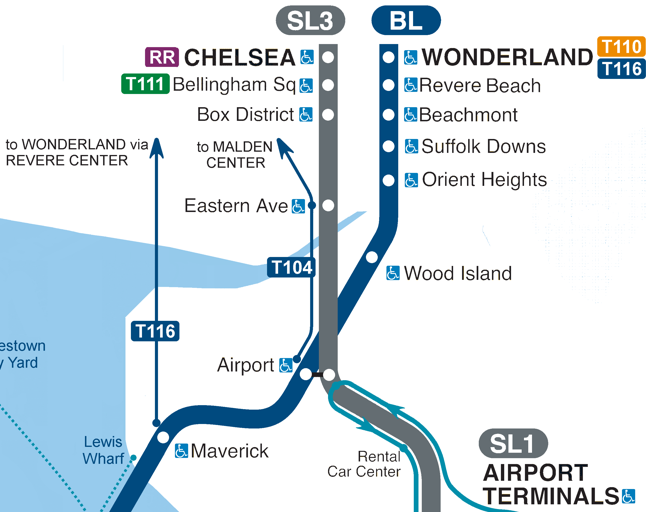
Instead of using the current diagram’s “light brown” for the Key Bus Routes, or the official brand guidelines’ “Brand Bus Yellow”, the bus routes have been color-coded based on the hub they operate into. This is far from a perfect system, and in some cases I had to make arbitrary choices. (For example, the T7 and many of the routes running through Roxbury Crossing are colored based on running through State St and Roxbury Crossing respectively, e.g. major transfer points the route travels through rather than to.) Still, I think it is a useful way to differentiate the routes, and somewhat inadvertently highlights the new connectivity of the redesigned routes (e.g. the T28 being a Green route, or the T110 connecting Wonderland to the Orange Line).
Fairmount Line
With today’s timetables, the Fairmount Line should not appear on the map using equal visual language to the rapid transit lines. However, increasing frequencies to “turn-up-and-go” levels should be a major priority for the T and the City, and I wanted this diagram to be future-proofed to enable that.
Silver Line, simplified
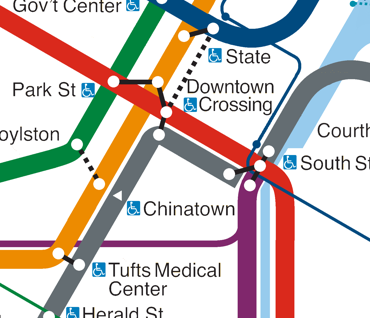
The Bus Network Redesign has given us would-be transit map designers a godsend: the elimination of the SL4/SL5 reverse branching & loops. Now we have a simple dog-leg that slots nicely alongside the Orange and Red Lines. The only hiccup is (as I interpret the Remix map), Chinatown will receive northbound service only. I have opted to subtly mark this using a directional triangular for the stop, instead of a circle, and excluding a Silver-Orange transfer indicator at Chinatown (compare to Tufts Medical Center). On a “real” version of this map, the Chinatown label would probably get an asterisk with a note in the legend to the effect of, Silver Line stops at Chinatown going northbound only.
Park St, Winter, Summer, and Washington
This probably falls under the heading of “too clever by half”, but I’m still pleased with it. In general, this map does not mark transfers particularly explicitly. I experimented using black circles, or black dots within circles, but the black circles created contrast problems and the black dots were too subtle.
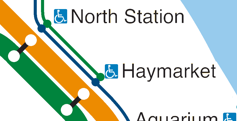
Instead, the indication of transfers is derived from the physical positions of the stops. For example, the Blue-Green transfer at Government Center is indicated by the Blue and Green Lines sharing a stop indicator. As it happens, only two transfers are marked in this manner: Park St and Government Center.

The rest are marked using transfer bars to connect visually distinct stops. In some cases, the visual distance is a design artifact: for example, the Green-Orange transfer at North Station or the SL1/2/3-Red transfer at South Station are in reality basically as proximate as, e.g., the Red-Green transfer at Park St.
But one benefit is that two of the more complicated transfers are visualized accurately: State, and Park/Downtown Crossing.
State
The transfer between the Blue Line and the southbound Orange Line (the platform formerly known as “Milk” after the cross-street above) is, I believe, the longest in-station transfer on the system. From the western end of the Blue Line platforms to the northern end of the Milk Street platform (I believe under the intersection with School St) is about 800 feet, as I estimate. By comparison, the Green-Orange transfer via the Winter Street Concourse is about 550 feet.

All things being equal, I don’t see a particular need to visually indicate this lengthy transfer distance. However, I chose to add it because I wanted to implicitly indicate that the T7 transfer (on Congress St) is more proximate to the Blue Line than to the Orange Line. So I wanted to separate out the Blue Line station from the Orange Line.
Park & Downtown Crossing
At Park St, the Red Line platform is more-or-less directly underneath the Green Line platform. By contrast, at Downtown Crossing, the Red Line platform is about 200 feet away from the Orange Line platform, with its western edge a little bit west of Hawley Street.
The offset Red Line platforms historically haven’t mattered too much from a map-making perspective. However, with the redesigned SL4/5 route, there will be a minor distinction worth making:
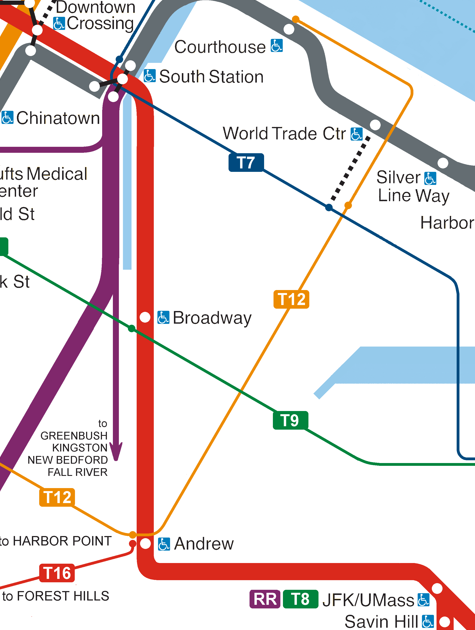
In a clever bit of route design, SL4 and SL5 are going to be combined into a single route that serves Tufts Medical Center, Downtown Crossing, and South Station in a linear fashion, with bidirectional service at each stop. However, instead of serving Downtown Crossing at Temple Place, the new Silver Line stop will be flipped over to Chauncy St – directly outside the entrance to Downtown Crossing at the far end of the Red Line platform.
So, I wanted to indicate on the map that Downtown Crossing will provide a good Silver-Red transfer but subtly suggest that Silver-Orange transfers are better taken at Tufts Medical Center. By separating out the Red Line station (nee “Washington”) from the Orange Line stations (“Winter” and “Summer”), the diagram is able to show exactly that. Again, in this case the physical layout of the network in the real-world has provided the needed design specification.

Drawbacks
There are two sets of problems with my diagram: some problems are execution-related and presumably could be remedied by the touch of a professional; others are conceptual and endemic to the idea of the map itself. Of the drawbacks listed below, I’m not sure which are execution-related and therefore “salvageable”, but I’ll make some guesses.
Busy margins and excess inner blank space
This one I think is execution-related and could be ameliorated by some mild tweaking. This diagram is very busy at the margins overall. To a certain extent, this is by design: I always knew that the outer regions of the diagram were going to be busy with station lists. However, I think the “inner map” section could be compressed by maybe 20%, and free up much needed space, especially at the bottom of the diagram. (For example, there really doesn’t need to be that much space between stops on the Southwest Corridor; the SL4/5 stops probably are the limiting factor here, but they too definitely could be closer together.)
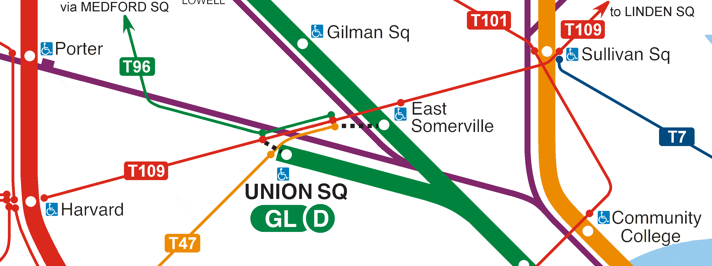
Likewise, I think the “inner map” could also be further compressed along the “Red Line axis”, particularly in the northeast corner. Harvard and Central could both be moved in closer to the core, which would free up more space. For example, the T47 does a small bend at Central right now: in a future revision, I would move Central in closer to the core so that the T47 could run in a straight line between BU Bridge and Union Sq, which would “tug” the northern branches of the Green Line and Red Line further in toward the center. (Looking at it now, I think this would also actually place Central in a more geographically correct location, for what it’s worth.)
Ironically, even though I’m talking about freeing up more space in the top left quadrant of the diagram, in all likelihood I would instead use that space to simply relocate the rest of the map upward, in order to free up more space in the bottom half. The centerpoint of the diagram is currently roughly at the Hatch Shell on the edge of the Charles. In a future revision, I would probably shift things so that the centerpoint is at Back Bay Station.
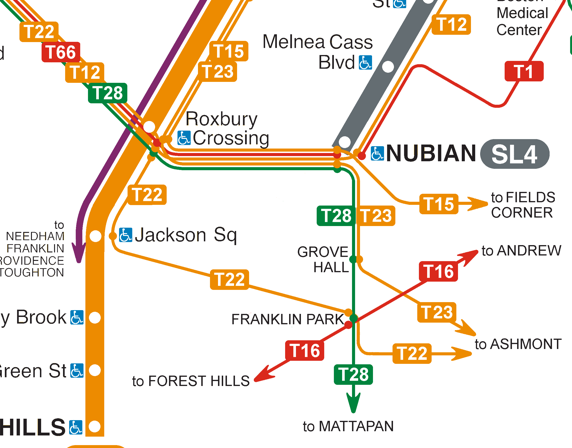
The busyness of Longwood and Dorchester
These are the parts of the diagram where the shape of the bus network is most germane. The criss-crossing lattice of the Dorchester network does not lend itself to simple labels like “to Ashmont” placed just south of Nubian (which would mirror what I did at Harvard and Sullivan). As for Longwood, the Bus Network Redesign will radically increase bus service to LMA, which definitely merits inclusion on the map, but is challenged by:
- Fitting in labels for four bus routes on one segment (between Roxbury Crossing and Brigham Circle)
- Fitting in a parallel-but-nearby route for the T47
- Showing appropriate proximity to the E Line
- Showing appropriate proximity to the D Line (farther away from the E Line)
- Illustrating connectivity to Kenmore and Ruggles
- Fitting in labels for the E Line and D Line
- Fitting everything within the obtuse triangle defined by Copley, Kenmore, and Brookline Village/Riverway
I think the busyness can be partially alleviated by adjusting the compression of the inner core and re-centering the inner core a bit higher up in the diagram to open up a bit more space.
That being said, I think this is a conceptual shortcoming of the map: Longwood and Dorchester both represent areas where higher geographic fidelity is needed, in part simply because the topologies are complicated enough that the geographic representation already is pretty close to the maximally simplified representation of the network.
Unfortunately, this diagram is less effective at fitting in geographic accuracy the further away from the core you get. That’s why re-centering the diagram on Back Bay (or even something further south) is necessary – we need to provide more space for Longwood to fit comfortably within the inner zone.
Dorchester, on the other hand, will likely still have to remain within the “diagrammatic outer zone”, although I think it would also benefit from a little more “breathing” room. That being said, this may be where my design concept for this diagram really breaks down: I dislike the current diagram’s treatment of the Dorchester bus network because I think it looks confusing and hard to read, but I’m not sure mine does that much better.
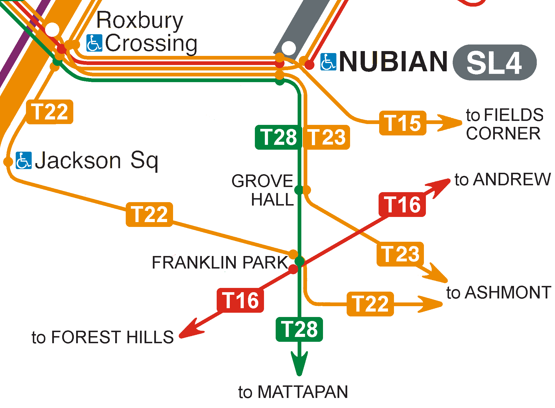
The “starfish” design centered on Franklin Park feels pleasantly clever, but I worry is still too noisy. Likewise, I’m not wild about the physical disconnect: the bus line ends with an arrow, followed by a “To Destination” label, followed by a relatively small amount of blank space, followed by the diagrammatic stop label with the transfer label (e.g. the T16 going toward Forest Hills). Why not just extend the bus lines all the way to their destination?
(The reason I didn’t do that is because I’m using the absence of the bus and regional rail lines as a visual cue to the shift from geographic fidelity to diagrammatic lists. Now, it is true that the visual distortion would still remain so extreme that the transition would probably still remain visible. But, that corner of the diagram is already so busy that I’d be hesitant to layer on additional visuals.)
I suppose it could be possible to redesign the diagram such that the geographically accurate “inner zone” extends as far south as Forest Hills and Ashmont. Looking at the diagram now, that actually might be more feasible than it sounds, particularly with some compression and reduced scale, so I may need to play around with that!
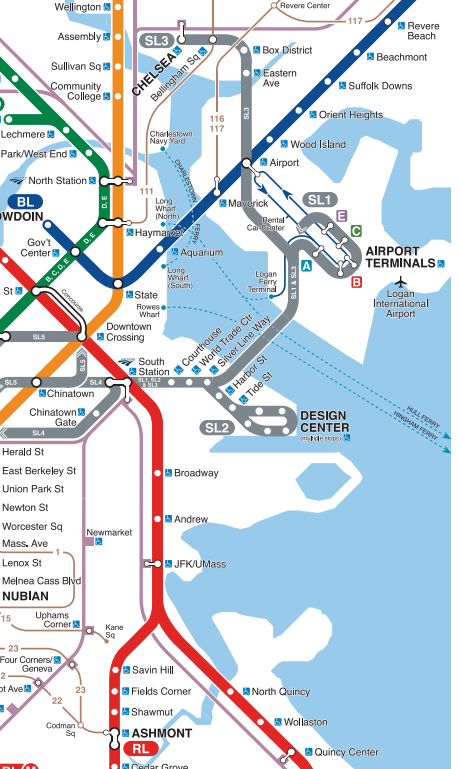
Branches on the Green Line
The Green Line branches pose a problem: there are way more stops on the B, C, and D branches than there are on any other leg of the network (though Ashmont + Mattapan come close). What’s more, they are the only legs of the network that fan out to the side of the map, rather than the top or bottom, which makes the “diagrammatic list of stations” less obviously different in appearance. And on top of that, I ultimately wanted to make sure all three branches terminated “lower” on the map than Kenmore – meaning I couldn’t, say, turn the B Line upwards to fit it in as a list of stations.
I’m not thrilled with how the Green Line branches turned out, but I do think the concept can be sound, particularly if I can free up a bit more space to let me put the B Line labels on the outside rather than the inside (where they mix confusingly with C Line labels).
(One note: this design is meant to be future-proofed for an addition of a Needham branch: flip the D Line labels past Newton Highlands over to the left side, and use an upside-down tuning fork approach to add the Needham labels on the right, similar to the Red Line branches.)
Conclusion
Does the design concept of a geographic inner zone and a diagrammatic outer zone “work”?
Ultimately, I think the answer is “yes”: I think the fundamentals of this concept are sound, and it’s a question of execution.
As the “15-minute Bus Network” is rolled out over the next few years, it’ll be more and more important for the T to update its map to integrate those routes properly into the design. I hope that an approach similar to what I’ve illustrated here can be helpful in such a redesign.