In my previous post about branches, I briefly discussed the rapid decrease in frequencies as you add more branches to a trunk line. You might remember a diagram that I showed:
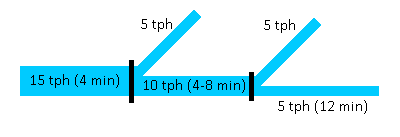
In this diagram, the trunkline sees high-frequency headways of 4 minutes (which is better than many subway lines in North America). With such a high frequency, it’s easy to think that there’d be enough trains to serve a bunch of branches.
But as you can see, four-minute headways equals 15 trains per hour. If you have three branches, that means each branch gets 5 trains per hour – which yields 12 minute headways. If these branches are out in suburbia, 12 minute headways might be appropriate, but you’ve nearly reached the limit. If you were to add a fourth branch, each branch would see less than 4 trains per hour, at 16 minute headways, at which point you really no longer have a claim to “frequent service”.
In my last post, I recommended, as a rule of thumb, no more than two branches per line. However, I didn’t explain why. It comes down to a combination of typical throughput capacities, and mathematical inevitabilities.
Divvying up trains-per-hour among multiple branches
Consider this chart:
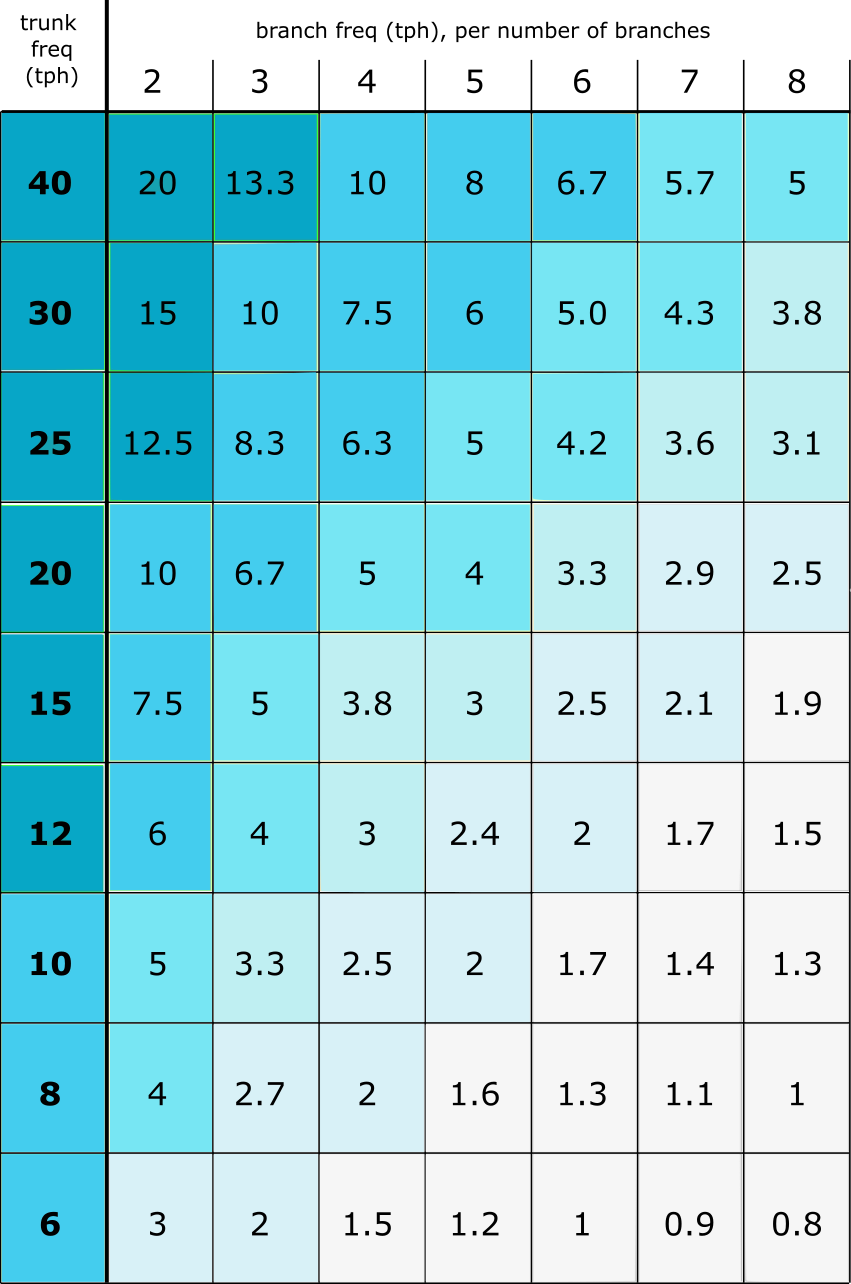
On the left side, we have a list of potential trunkline capacities, measured in trains per hour. These indicate how many trains in each direction you can squeeze through your trunkline in an hour. (Don’t worry about converting these numbers to headways – I’ll get to that below.)
For some perspective (most numbers pre-covid):
- BART ran 16 tph through its core section from Daly City to West Oakland
- CTA ran between 12 and 20 tph on its Red and Blue Lines during peak
- WMATA ran 15 tph on its Red Line during peak
- MBTA ran 15 tph on its Red Line during peak
- London Underground’s throughputs vary widely from line to line, with some lines seeing over 30 trains per hour, following major infrastructure and modernization improvements
- Beijing’s subway runs between 30 and 35 tph on several of its routes
- Shanghai’s subway runs between 15 and 32 tph on most of its inner routes
All of which is to say, the top few rows represent trunkline capacities that require major investment in transportation infrastructure.
To the right of those trunkline capacities are the number of trains available to each branch, depending on how many branches you have. So, for example, in the first row, a 40 tph trunk will provide 20 tph to two branches, 13.3 tph to three branches, 10 tph to four branches, and so on.
As mentioned before: you’ll notice that, as you move from left to right across the chart, the numbers in each row drop dramatically. In fact, the decrease is literally exponential; you can describe the chart above using
y = n-x
where n is the capacity of your trunkline in tph, x is the number of branches, and y is the resulting tph per branch.
Decreasing frequencies due to decreasing tph
It’s helpful to start this discussion using tph as a measure, because it’s easier to recognize the patterns in the numbers’ decrease. However, once we convert those tph into headways, it’ll become that much clearer why branching quickly leads to decreased frequencies.
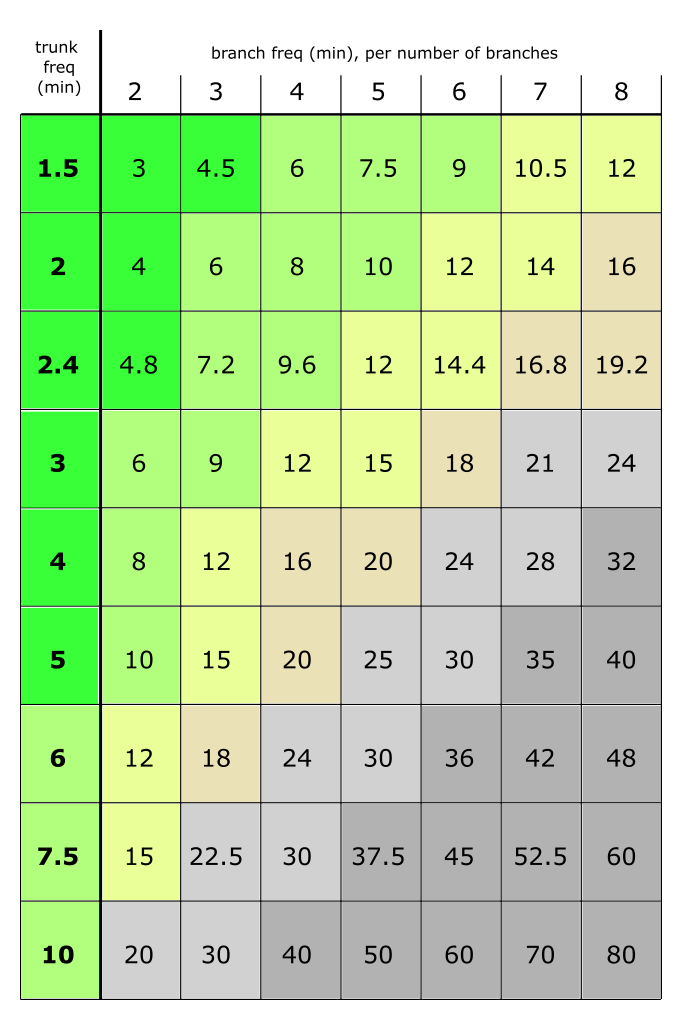
I’ve added some (opinionated) color-coding, meant to suggest the various “levels” of service these different frequencies provide.
- The bright green (every 5 minutes or better) represent the highest tier of frequent service an agency might provide. “Turn up and go.”
- The pale green (every 5-10 minutes) are still comfortably in the realm of rapid transit, but are probably better suited to off-peak periods and lower-ridership networks. “Turn up and wait a couple minutes and go.”
- The yellow (every 10-15 minutes) are the lowest tier of what could be considered “turn-up-and-go,” describing services where riders don’t need to check a schedule when planning journeys. Call this tier “turn up and wait.”
- This tier should be approached cautiously, with careful attention paid to the specific corridor where these frequencies would be deployed.
- (Sadly, consideration should also be given to reliability; if a bus is scheduled to show up every 13 minutes, but one run gets dropped, suddenly you have folks waiting nearly a half-hour for their bus.)
- The subsequent tiers are rarely going to be considered “frequent service”; some could be “salvaged” by adhering to a strict clockfacing schedule: a route that reliably comes exactly :13 minutes and :43 minutes past the hour can be a useful service that isn’t “turn-up-and-go”, but doesn’t require consulting a schedule either. These tiers break down something like this:
- Orange = “plan when to leave, but journey whenever”
- Light grey = “plan when to journey”
- Dark grey = “schedule around the schedule”
As you can see, our frequencies drop through the tiers I’ve described above quite quickly. Once you hit the yellow tier, you’re teetering on the edge of frequent service, and once you hit the orange and beyond, you’re definitely over the edge.
Different regions will have different definitions of “high frequency”. For example, it’s pretty rare to wait more than 4 minutes for a tube train in central London; a six-minute headway would be considered sub-par. In Boston, we are sadly accustomed to six-minute peak headways on the Orange Line, while Baltimore’s subway sees peak service every 8 minutes.
It’s worth highlighting that reaching 90-second headways at 40 tph on heavy rail is exceptionally difficult. If you have multiple tracks in the same direction, it becomes more manageable, but a standard two-track subway is nearly impossible to operate at 40 tph per direction, outside of the world’s most advanced subway systems. And notice – even the top examples I listed above, such as Beijing or London, you’re still looking at that second row as your baseline, at around 30 tph. Even in those systems, having more than two branches knocks each branch down into a lower “tier”, meaning it’s not suitable to do within the urban core.
If your crayon map requires shoveling 40 trains per hour through a trunk line, then probably it’s worth trying to plan a second trunk line!
Gaming out examples, and dealing with the unideal real world
Many of the North American systems I mentioned above see 4 minute headways on their core. If we go to that row, we can see two branches gives us 8 min (good so far), three branches gives us 12 min (borderline), and four branches gives us 16 min (no good).
Some North American systems see base headways of 7 or 8 minutes. In that case, our drop-off happens even faster: 2 branches becomes borderline, and 3 branches sinks us with headways longer than 20 minutes.
On the London and Chinese systems mentioned above, trunklines see headways around 2 minutes or better. In theory, those trunklines could accommodate five or six branches; but if you drop the core headways by just one minute, suddenly you can only accommodate three or four branches at similar frequencies.
And that “in theory” caveat is what’s really going to get us. Even if you can squeeze 30 tph through your trunkline to get 2-min headways, if you are feeding that trunk from five branches, that’s five times as many opportunities for delays and disruptions. We just saw above that the difference between a 2-min headway and a 3-min headway is worth two whole branches of throughput. That’s a very thin margin for error – meaning that you need reliability to be extremely high, or else the whole system will unravel, with cascading delays across your network.
The exceptions that prove the rule: North American legacy subway-streetcar networks
There are only two networks that I’m aware of which see sub-10 minute headways on four or more branches, feeding into a trunkline handling 40 tph: the MBTA’s Green Line and SEPTA’s Subway-Surface Lines.
This level of throughput is achieved (see caveat below) mostly because they are light rail lines rather than heavy rail. This means shorter trains which can start and stop faster, and therefore can be run closer together (albeit at lower speeds). The MBTA allows multiple Green Line trainsets to enter certain stations simultaneously, and SEPTA actually treats a couple of its subway stations as “request stops”, with trolleys rolling through non-stop if no one signals to board or alight.
(I haven’t done the math on this, but it would be worth someone calculating the actual capacity of those two systems compared to heavy rail equivalents. It is true that the TPH levels are higher, but since the trains are shorter, I don’t know that you actually end up carrying more passengers.)
The reality, sadly, is that both of these networks are infamous for their reliability issues. (Full disclosure: I’m much more familiar with the MBTA than SEPTA, but I believe most of the T’s problems also exist in Philadelphia.) Delays are common, both on the branches and then resultantly in the core, potentially resulting in less than forty actual trains per hour through the core.
Having four or five branches is somewhat workable on these two systems due to their unusual characteristics. Replicating that success elsewhere would likely require replicating those characteristics as well.
The other exceptions that prove the rule: hybrid rapid transit/commuter rail systems
BART’s core trunkline from Daly City to West Oakland feeds out into four eastern branches (Richmond, Antioch, Dublin/Pleasanton, Berryessa/North San Jose). Likewise, the London Undergroud’s Metropolitan Line runs to four termini in the northwestern suburbs (Uxbridge, Amersham, Chesham, Watford).
Both networks accomplish this by running service to distant suburbs that is more like high-frequency commuter rail than traditional rapid transit service. Each branch on the BART runs every fifteen minutes, which isn’t super unreasonable given that most of those branches travel over thirty miles from downtown San Francisco. (BART is also a pluricentric network, which makes the ridership patterns a bit different than, for example, Chicago’s.)
The Met in London is a bit more complicated, but the concept is similar. Similar to New York, and unlike BART, the Metropolitan is quad-tracked for certain stretches, and therefore runs both local services and express services. During peak hours:
- Uxbridge sees 10 tph (6 min) spread across local and express services, with 4 of those trains short-turning at Baker Street
- Amersham sees 4 tph (15 min), half of which are express
- Chesham sees 2 tph (30 min)
- Watford sees 8 tph (7.5 min), again with some short-turns and some expresses
A couple of further notes for context:
- Almost all of the Uxbridge branch is also served by Piccadilly trains – 12 tph at peak – providing a robust 22 tph, which creates headways under 3 minutes
- The Amersham and Chesham services run together until Chalfont & Latimer, before splitting off and going one stop each to their terminus, meaning most of the branch in fact sees 6 tph; these services are also supplemented by at least 2 tph that run on Chiltern Railways to Amersham and beyond.
- Chesham is also the most distant Underground station – 25 miles from Charing Cross in central London, and technically outside of Greater London – well into territory where 30-minute headways might be reasonable
- The town of Watford is served by three other stations; the largest of these is Watford Junction, which is less than a mile from the Met station, and sees 4 Overground trains and about 5 London Northwestern Railways trains toward London per hour
So, the Met has a few mitigating factors:
- Its branches are supplemented by additional services
- Despite four possible termini, really it just has three branches, one of which splits at the very end
- The only stations that see 15-minute-or-worse headways are distant suburbs, over 20 miles from the core of London
Like SEPTA and the MBTA, both BART and the Metropolitan also have unusual characteristics that enable them to get away with breaking my “two branches max” rule of thumb.
However, both BART and the Met also have an additional special feature that allow them to have their cake and eat it too… to be continued in the next post!