Contents
Background and Goals
For the vanishingly few of you who both read this blog and are unfamiliar with the MBTA’s Bus Network Redesign, you can check out the details of the proposal on the MBTA’s website.
In short, the MBTA is undertaking its first bottom-up redesign of its surface transport network in 100 years. The vast majority of the T’s bus routes once were streetcar routes; some routes have seen minor-to-moderate modifications in the ensuing decades, but the need to avoid disrupting the live system — which governs the day-to-day realities of thousands of people — has always capped how much could be done. As part of the long-running Better Bus Project, the T has conducted a deep dive review of its existing routes, including their ridership and reliability (see the Better Bus Profiles) and user research speaking directly to riders and community members.
Years in the making, the T this month released a proposed redesign of its bus network — details at the first link. This is a massive undertaking, and I give the redesigners credit for very clearly trying to avoid the “We’ve Always Done It Like This” Syndrome that plagues so much of American transit planning (especially in Boston).
Like any proposal, it has its imperfections and flaws. From my perspective, there are some things I like, and some things I don’t. There already has been some initial community feedback, and the T has a docket of public meetings (in-person and virtual) through mid-summer to collect feedback.
For the most part, I don’t intend to use my platform here to evaluate the merit of these proposals. The most important voices here are those of community members — their opinions should be listened to first, and given paramount consideration. Instead, my hope is to add to the discourse by providing additional ways to view and conceptualize the redesigned network — mainly through maps.
(There is one area of the proposal which received swift and strong public criticism. I have a post, and a pair of maps, in the works on that, where I will attempt to illustrate the flaws that have been pointed out by the community, and hopefully offer some modest suggestions to improve the proposal to address those problems. Stay tuned.)
In this post, I will share a map I have created to illustrate the Redesign’s “15-minute network”: a series of bus routes that are proposed to have 15-min-or-better headways all day from 5am to 1am, seven days a week. I’ll use the map to highlight some system-level features of the Redesign, and hopefully provide a framework for deeper discussion.
The Previous 15-Minute Network
Some of you may recall that I made a similar map of then-current all-day high-frequency MBTA bus services in the past. My methodology was a little different, so it isn’t a perfect comparison, but it is a useful starting point for our discussion today.

I also wrote on ArchBoston a detailed analysis of this network and its notable features, as well as a follow-up analysis specifically on the Dorchester network. There were a few things that stood out in that analysis:
- Very few circumferential or crosstown corridors — almost everything was radial
- Morning peak frequencies were often higher than afternoon
- The bus network “breathes”
- An entire subnetwork of high frequency services turns on and off during the peak, providing much more comprehensive service during rush hour, but a signficantly sparser network during middays, evenings, and weekends
- The entire northern quadrant of the network — everything between the Red Line and the Blue Line — was bereft of (intentional) high-frequency all-day routes, with the sole exceptions of the 111 in Chelsea and the 116/117 in Chelsea/Revere
- Some communities, like Everett, don’t show up on the “Gold Network” (high freq all day) because they are instead served by a more diffuse number of routes spread across the city, operating at lower frequencies
- The absence of the North Shore network — meaning the absence of consistent high frequency service — was conspicuous
- The Dorchester network is one-of-a-kind, with features that don’t exist elsewhere
- The network itself is actually three networks superimposed: a “10-minute all-day network”, a “15-min peak, low off-peak network”, and a “low frequency network” — most routes fall very cleanly into one of these three buckets
(Interestingly, that last point about the Dorchester network[s] seemed to be on the mind of the Redesigners as well — they’ve also adopted three primary tiers: a “≤15-minute all-day network,” a mid-frequency network that I’m guessing will be “15-min peak, 30-min off-peak”, and a low frequency network that, like Dorchester’s, would mostly see hourly services. I won’t really go into much detail here, but in my previous analysis, I did note consistent characteristics about each of the Dorchester subnetworks, and I see many of those ideas applied systemwide in the Redesign.)
I mention all of these points because I believe the Redesign recognized these features as well, and explicitly designed their proposal to address them.
The Proposed 15-Minute Network
The Redesign calls for a series of 26 high-frequency routes that would see 15-min-or-better headways all day everyday from 5am to 1am. This proposal goes much farther than the system I described above — in particular with its commitment to late night and weekend service. Vanishingly few corridors see any level of service approaching this currently. Routes on this network would be indicated by a “T” prepended to their route number: the T39, the T111, and so on.
I’ve spent a while digging through the weeds of the Redesign, and have concluded that the 15-Minute Network is composed of three kinds of routes.
Radial Routes
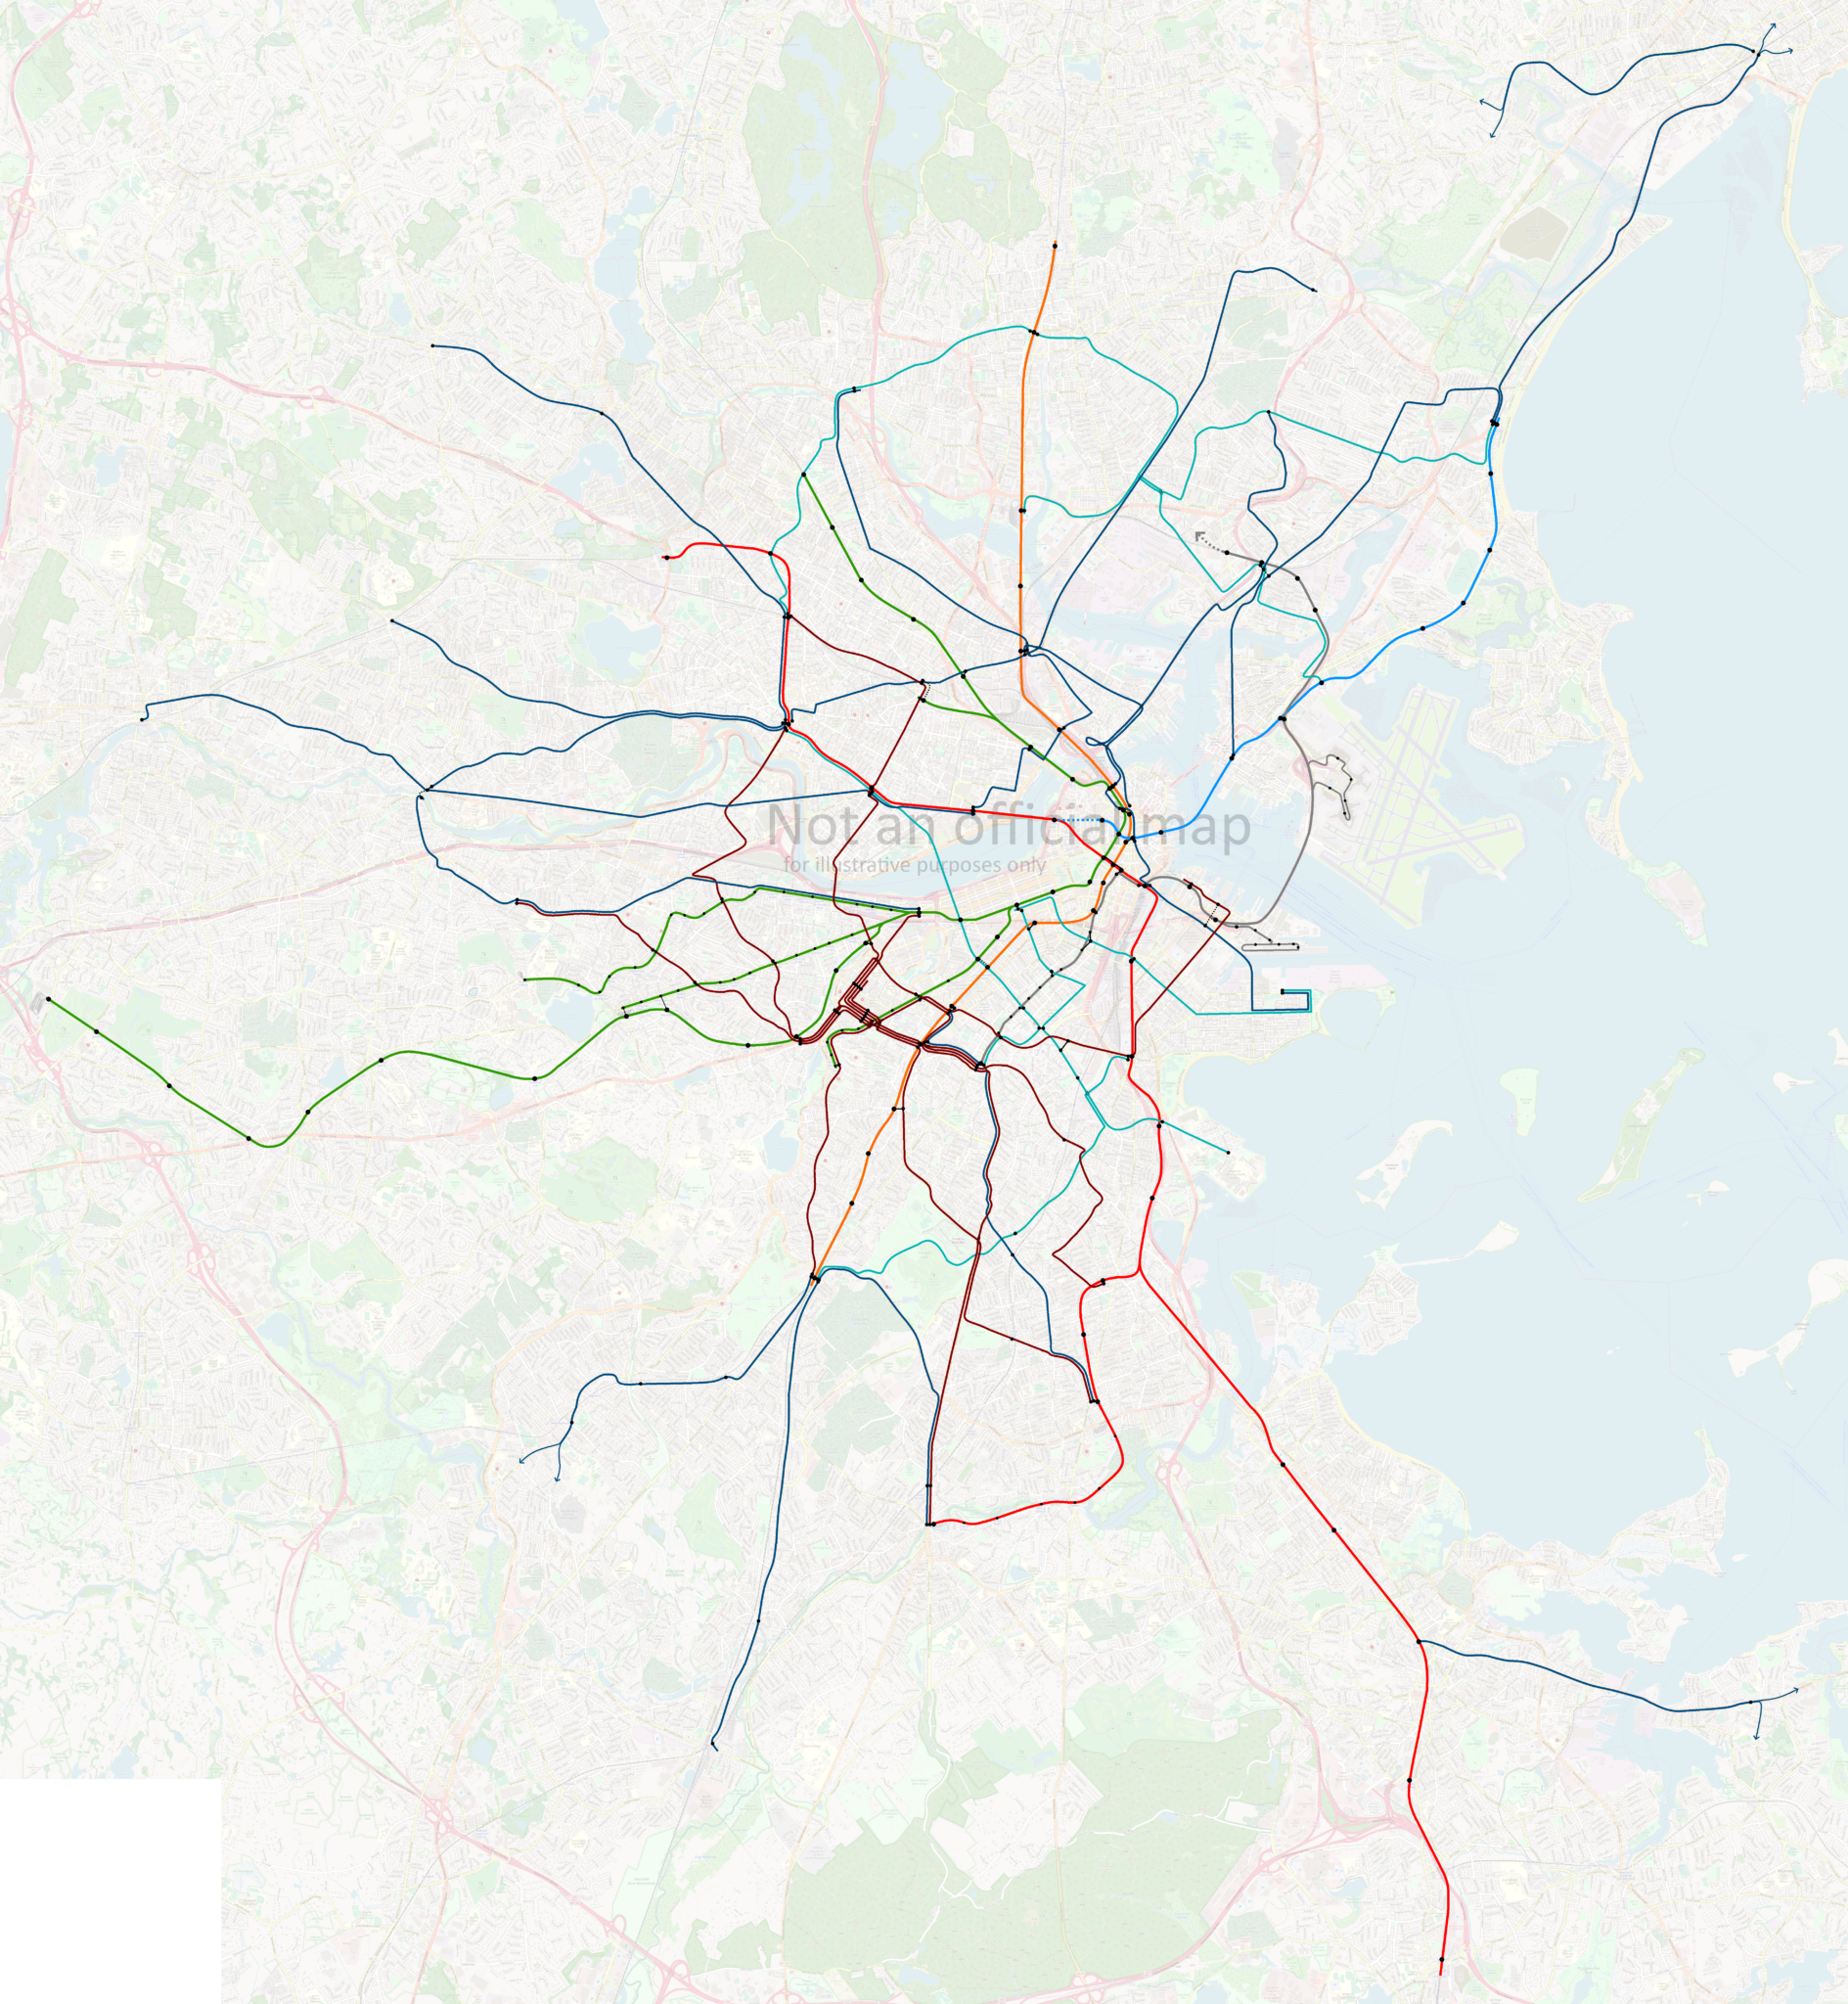
These are straightforward: routes that radiate out from the core, and which feed into major transfer stations such as Harvard or Forest Hills. On my map below, I have used a dark blue for these routes. Most of these routes are unsurprising, and many of them are identified on my Gold Network map above.
Circumferential Routes
These routes offer crosstown service that goes around the core rather than pointing toward it. Some of these routes behave like radial routes as they approach their terminals; for example, the southern half of the T96 essentially radiates out from Porter and Davis. So these routes still will be used by commuters going to downtown — but they also will enable journeys between multiple subway lines that can avoid going all the way to downtown. The T1 is a classic example, connecting Roxbury and Cambridge without requiring riders to change at Downtown Crossing.
Two exceptions
There are two proposed routes that do not fit cleanly into the categories above or below: the T109 and T101, both running through Sullivan. North of Sullivan, they behave clearly like radial routes, to Medford/Malden, and to Everett/Malden. South of Sullivan, they do something that bus routes historically have not done: continue on from one transfer station to another.
Traditionally, these would be considered circumferential routes. However, I have mapped them as radial routes — I believe the Redesigners are trying to reconceptualize these corridors as radiating instead from Harvard and from Kendall, passing through Sullivan somewhat incidentally. I of course have no insight into their actual thought process, but I think it reflects general trends they’ve shown in favor of longer routes that pass through multiple quadrants of the system.
Longwood Medical Area Routes
This is by far the most seismic shift in the redesigned network. For the first time, Boston is proposing a transit network that acknowledges that Longwood is a major employment center, a third “downtown” equivalent to Back Bay and the Financial District. See for yourself:

The current network requies riders to rely on employee shuttles, bus transfers at Ruggles, funneling riders on to the E Line and D Line, and lengthy walks. Despite being less than 2 miles away, commuters to LMA from Warren St currently have a single one-seat option — the 19, which only runs to Longwood during peak hours, mostly falls short of 15-minute headways during peak, stops running altogether by mid-evening, and offers no weekend service. (And it was no better pre-pandemic either.)
The Redesign proposes extending most major routes from Ruggles beyond to Longwood; it extends Cambridge crosstown service beyond Central to Inman, Union, and Porter; it adds a new crosstown route to the Seaport; and it increases frequencies on most existing routes.
When I did my analysis in 2020, the Kenmore-Longwood-Ruggles corridor saw 15 buses per hour during the morning peak, 4 per hour midday, and 6 per hour during the evening peak. The Redesign notes that exact routings through LMA are tentative pending further study, but by my count, the number of buses per hour between Longwood and Ruggles, Nubian, or Roxbury Crossing is proposed to increase to at least 20 buses per hour, all day.
I’ve colored the Longwood routes in dark red on the map. Some also act as radial routes to other hubs, and some do double duty as circumferential services in the larger network. But Longwood is undeniably the center of gravity, and makes for a distinct subnetwork, worthy of its own identification.
The Map
A few additional notes here:
- This map is my creation, based on materials published by the MBTA; it is not an official map and any errors are mine. I recommend using my map as a jumping off point before reviewing the official materials.
- Each route is marked separately and indicates a minimum of 15-minute headways (4 buses per hour) all day every day — I am sure that many if not most routes will see significantly higher headways during peak
- Certain major bus stops are indicated, largely for the purpose of indicating transfer points to rapid transit; stop placement is not exact
- Some potential “transfers” would require some walking, indicated by a dotted black line
- The proposed Blue-Red Connector and potential Silver Line Extensions are indicated with dotted lines
- Some corridors see high-frequency service provided by layered mid-frequency services; these are mostly indicated by the line splitting and ending with arrows
- This map is not precise and is meant to illustrate the overall network, not detail individual routes
- Some routes have been simplified to reduce clutter. For example, the T39, T9, T70, and most of the routes in Chelsea, all have significant stretches where the route splits on to parallel one-way streets; most of these, I have simplified by drawing the route through the block in between the streets
And voilà:

If the full-size version is killing your browser, here is a link to a slightly lower-resolution version.
Here’s a detail view on Back Bay and Longwood, probably the most visually cluttered part of the map:

Conclusion
I do want to emphasize again that I am not trying to evaluate the quality or suitability of the Better Bus Project’s Bus Network Redesign proposals. There are elements of the proposal that I believe are transformative in that they are shifting the conversation in ways that are vitally necessary: centering Longwood, insisting on consistent high frequencies all day everyday, and creating wholesale new corridors that do not descend from the old streetcar network.
But the devil is always in the details, and there are many details to sort through in this proposal. My hope is that my overview and map can make it easier for you to wrap your head around this sprawling project, and from there, dive into the details, well-armed with a larger context.
